In the News:
Hurricane Isaac Shuts-In Significant Gulf of Mexico Natural Gas Production
Natural gas production in the Gulf of Mexico has declined sharply since August 25, when producers began evacuating platforms in preparation for Hurricane Isaac. As of August 29 at 11:30 a.m. CDT, 505 oil and natural gas platforms (almost 85 percent of manned Gulf of Mexico platforms) had been evacuated, according to the Bureau of Safety and Environmental Enforcement (BSEE). BSEE reports that about 3.2 billion cubic feet (Bcf) per day of natural gas production was shut in, about 72 percent of total Gulf of Mexico natural gas production. Approximately 95 percent of Gulf of Mexico oil production was shut in. Gulf of Mexico natural gas production from Louisiana has fallen the most, predictably, as the storm made landfall near New Orleans, according to BENTEK Energy LLC (Bentek). Bentek reports that some offshore and onshore production has continued in Texas.
The Department of Energy (DOE) is providing ongoing situation reports on the status of production, power outages, and oil and natural gas infrastructure in the affected area. As of August 30 at 8:00 a.m., 8 companies had declared force majeure on their natural gas pipeline systems due to production shut-ins, and several others had reported curtailments. DOE also reported that 22 natural gas processing plants are shut down due to Isaac; these plants have a combined capacity of 11.8 Bcf per day.
Overview:
(For the Week Ending Wednesday, August 29, 2012)
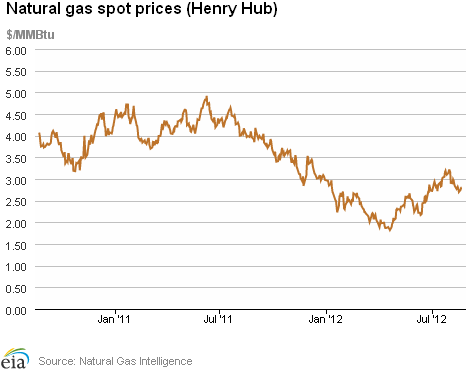
- Natural gas prices generally registered overall decreases for the report week (Wednesday to Wednesday) at many of the country's trading locations. The Henry Hub price, which remained fairly steady through much of the week, dropped 8 cents per million British thermal units (MMBtu) on Tuesday and an additional 9 cents per MMBtu yesterday, closing at $2.63 per MMBtu (down 17 cents per MMBtu for the week).
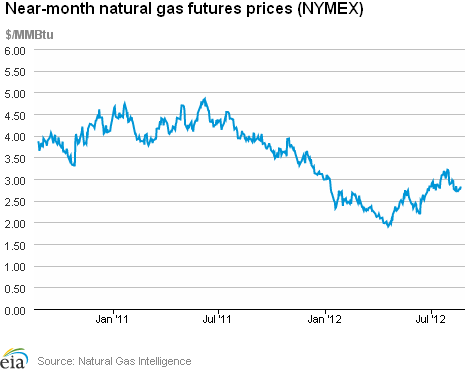
- The natural gas futures market trended significantly downward throughout the week before rebounding at week's end. At the New York Mercantile Exchange (NYMEX), the September 2012 natural gas contract lost 19.2 cents per MMBtu to close at $2.634 per MMBtu yesterday.
- Working natural gas in storage rose last week to 3,374 Bcf as of Friday, August 24, according to the U.S. Energy Information Administration's (EIA) Weekly Natural Gas Storage Report (WNGSR). An implied storage build of 66 Bcf for the week positioned storage volumes 429 Bcf above year-ago levels.
- The natural gas rotary rig count, as reported by Baker Hughes Incorporated on August 24, increased by 2 to 486 active units. Meanwhile, oil-directed rigs dropped by 17 to 1,408 units.
Prices:
The Henry Hub day-ahead price registered a moderate decrease for the week, shedding a combined 17 cents per MMBtu on Tuesday and Wednesday, closing the week at $2.63 per MMBtu, down 6.1 percent. In the Northeast and Midwest, generally above-normal temperatures helped generate moderate price increases earlier this reporting week, although increases were typically temporary, with prices finishing the week lower in most locations ahead of forecasts of cooler weather.
At the NYMEX, the September 2012 contract (which expired yesterday) ended the week down significantly, declining from $2.826 per MMBtu last Wednesday to $2.634 per MMBtu yesterday, a decrease of 19.2 cents per MMBtu. Prices dropped steadily throughout the week, falling to $2.614 per MMBtu on Tuesday, but rose yesterday to finish the week down 6.8 percent. The 12-Month Strip (average of September 2012 to August 2013 contracts) closed yesterday at $3.163 per MMBtu, down 15.3 cents per MMBtu (4.6 percent) for the week. The October contract, which moved into the near-month position today, dropped steadily from $2.863 per MMBtu last Wednesday before rebounding yesterday to close the week at $2.685 per MMBtu, down 6.2 percent for the week.
Prices at many downstream trading locations registered overall declines, rebounding at times during the week but ultimately losing ground by week's end. For example, spot prices at the Transcontinental Pipeline's Zone 6 trading point (which serves New York City markets) started the week at $2.88 per MMBtu, rose to $2.93 per MMBtu on Thursday, fell to $2.85 per MMBtu on Friday, nearly fully recovered on Monday, then dropped throughout the rest of the week to end at $2.82 per MMBtu (down 2.1 percent). Similarly, at the Chicago Citygate trading point, prices posted an early increase from the week's $2.98 per MMBtu start, but fell steadily over the balance of the period to finish the week at $2.75 per MMBtu (down 3.8 percent for the week).
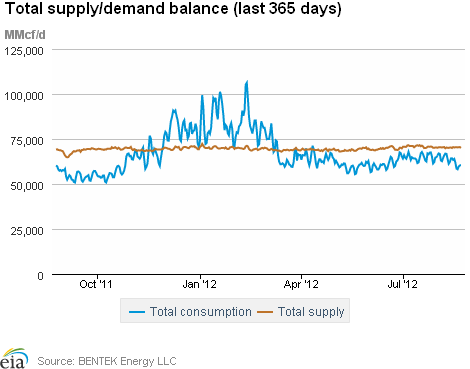
Total consumption for the report week registered an overall increase, with higher power and industrial sector demand offsetting a decrease in residential/commercial demand. According to estimates from Bentek, domestic natural gas consumption rose by 0.6 percent from last week, driven by an increase of 3.6 percent in power sector consumption. Residential/commercial sector consumption finished the week down 7.4 percent, while industrial sector consumption was essentially unchanged (up 0.3 percent). Although down week-over-week, residential/commercial sector consumption exceeded levels for the same week last year by 2.5 percent.
Total supply for the week was down for the week, registering an overall decrease of 2.8 percent, largely reflecting production shut-ins in the Gulf of Mexico due to Hurricane Isaac. According to Bentek estimates, domestic weekly dry gas production declined 3.3 percent from the previous week's volumes (and was 0.8 percent lower than the same period last year). Imports from Canada rose by 1.6 percent, as an increase in shipments to the Midwest offset decreases in the West and Northeast. For the week, imports from Canada stand close to year-ago volumes (down 0.7 percent). While liquefied natural gas (LNG) sendout rose 26.6 percent over last week, sendout volumes remain well below (28.1 percent) year-ago levels.
Storage
Working natural gas in storage increased to 3,374 Bcf as of Friday, August 24, according to EIA's WNGSR. This represents an implied net injection of 66 Bcf from the previous week. This week's injection was 4 Bcf above the 5-year (2007-2011) average injection of 62 Bcf, and 6 Bcf above last year's injection of 60 Bcf. Since April 20 it was the first time that injections of working natural gas into underground storage were above both year-ago levels and the 5-year average, and stocks remain well above historical levels. Inventories are currently 429 Bcf (14.6 percent) greater than last year at this time and 361 Bcf (12.0 percent) greater than the 5-year average.
All three storage regions posted increases this week. Inventories in the East, West, and Producing regions increased by 47 Bcf (the 5-year average net injection is 53 Bcf), 3 Bcf (the 5-year average net injection is 3 Bcf), and 16 Bcf (the 5-year average net injection is 5 Bcf), respectively. In the Producing region, working natural gas inventories increased 9 Bcf (4.1 percent) in salt cavern facilities and increased 7 Bcf (0.8 percent) in nonsalt cavern facilities.
Temperatures during the storage report week were 1.3 degrees cooler than the 30-year normal temperature and 3.4 degrees cooler than the same period last year. Temperatures in the lower 48 States averaged 72.3 degrees, compared to 75.7 last year and the 30-year normal of 73.6. While overall temperatures were about a degree cooler than normal, temperatures varied somewhat across Census divisions. The Pacific Census division in the West was particularly warm, averaging 4.4 degrees warmer than the 30-year normal. In the Midwest, temperatures in the East North Central and West North Central Census divisions were cool, averaging 4.9 and 4.0 degrees cooler, respectively, than the 30-year normal.
See also:
Shut-in natural gas production: U.S. Gulf of Mexico
billion cubic feet per day
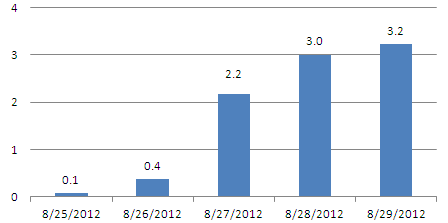
Source: Bureau of Safety and Environmental Enforcement
| Spot Prices ($/MMBtu) | Thu, 23-Aug |
Fri, 24-Aug |
Mon, 27-Aug |
Tue, 28-Aug |
Wed, 29-Aug |
|---|---|---|---|---|---|
| Henry Hub | 2.81 |
2.80 |
2.80 |
2.72 |
2.63 |
| New York | 2.93 |
2.85 |
2.92 |
2.85 |
2.82 |
| Chicago | 2.93 |
2.88 |
2.85 |
2.78 |
2.75 |
| Cal. Comp. Avg,* | 2.88 |
2.81 |
2.84 |
2.78 |
2.78 |
| Futures ($/MMBtu) | |||||
| September Contract | 2.802 |
2.702 |
2.653 |
2.614 |
2.634 |
| October Contract | 2.839 |
2.734 |
2.673 |
2.633 |
2.685 |
| *Avg. of NGI's reported prices for: Malin, PG&E citygate, and Southern California Border Avg. | |||||
| Source: NGI's Daily Gas Price Index | |||||
| U.S. Natural Gas Supply - Gas Week: (8/22/12 - 8/29/12) | ||
|---|---|---|
Percent change for week compared with: |
||
last year |
last week |
|
| Gross Production | -0.77%
|
-3.32%
|
| Dry Production | -0.77%
|
-3.33%
|
| Canadian Imports | -0.68%
|
1.60%
|
| West (Net) | 20.19%
|
-4.71%
|
| MidWest (Net) | -17.70%
|
12.92%
|
| Northeast (Net) | -4.50%
|
-4.42%
|
| LNG Imports | -28.07%
|
26.64%
|
| Total Supply | -0.92%
|
-2.84%
|
| Source: BENTEK Energy LLC | ||
| U.S. Consumption - Gas Week: (8/22/12 - 8/29/12) | ||
|---|---|---|
Percent change for week compared with: |
||
last year |
last week |
|
| U.S. Consumption | 1.50%
|
0.59%
|
| Power | 0.50%
|
3.62%
|
| Industrial | 2.83%
|
0.28%
|
| Residential/Commercial | 2.52%
|
-7.41%
|
| Total Demand | 2.56%
|
0.62%
|
| Source: BENTEK Energy LLC | ||
Weekly natural gas rig count and spot Henry Hub
active rigs$ per MMBtu
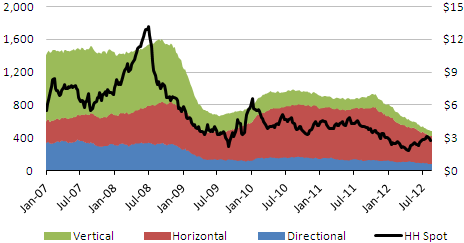
Source: Baker Hughes
| Rigs | |||
|---|---|---|---|
Fri, August 24, 2012 |
Change from |
||
last week |
last year |
||
| Oil Rigs | 1,408 |
-1.19% |
31.71% |
| Natural Gas Rigs | 486 |
0.41% |
-45.88% |
| Miscellaneous | 4 |
-20.00% |
-50.00% |
| Rig Numbers by Type | |||
|---|---|---|---|
Fri, August 24, 2012 |
Change from |
||
last week |
last year |
||
| Vertical | 519 |
-2.44% |
-14.50% |
| Horizontal | 1,159 |
0.52% |
1.67% |
| Directional | 220 |
-3.93% |
-3.51% |
| Source: Baker Hughes Inc. | |||
| Working Gas in Underground Storage | ||||
|---|---|---|---|---|
Stocks billion cubic feet (bcf) |
||||
| Region | 8/24/12
|
8/17/12
|
change |
|
| East | 1,759 |
1,712 |
47
|
|
| West | 491 |
488 |
3
|
|
| Producing | 1,124 |
1,108 |
16
|
|
| Total | 3,374 |
3,308 |
66
|
|
| Source: U.S. Energy Information Administration | ||||
| Working Gas in Underground Storage | |||||
|---|---|---|---|---|---|
Historical Comparisons |
|||||
Year ago (8/24/11) |
5-year average (2007-2011) |
||||
| Region | Stocks (Bcf) |
% change |
Stocks (Bcf) |
% change |
|
| East | 1,563 |
12.5 |
1,650 |
6.6 |
|
| West | 425 |
15.5 |
428 |
14.7 |
|
| Producing | 958 |
17.3 |
935 |
20.2 |
|
| Total | 2,945 |
14.6 |
3,013 |
12.0 |
|
| Source: U.S. Energy Information Administration | |||||
| Temperature -- Heating & Cooling Degree Days (week ending Aug 23) | ||||||||
|---|---|---|---|---|---|---|---|---|
HDD deviation from: |
CDD deviation from: |
|||||||
| Region | HDD Current |
normal |
last year |
CDD Current |
normal |
last year |
||
| New England | 3
|
-2
|
0
|
26
|
-3
|
-11
|
||
| Middle Atlantic | 3
|
-1
|
1
|
34
|
-9
|
-6
|
||
| E N Central | 15
|
8
|
11
|
15
|
-26
|
-32
|
||
| W N Central | 14
|
7
|
13
|
34
|
-21
|
-36
|
||
| South Atlantic | 0
|
-1
|
0
|
80
|
-7
|
-17
|
||
| E S Central | 0
|
0
|
0
|
60
|
-23
|
-43
|
||
| W S Central | 0
|
0
|
0
|
103
|
-15
|
-57
|
||
| Mountain | 2
|
-8
|
2
|
69
|
1
|
-24
|
||
| Pacific | 1
|
-4
|
0
|
69
|
27
|
22
|
||
| United States | 5
|
1
|
4
|
56
|
-8
|
-20
|
||
|
Note: HDD = heating degree-day; CDD = cooling degree-day Source: National Oceanic and Atmospheric Administration | ||||||||
Average temperature (°F)
7-Day Mean ending Aug 23, 2012
Source: NOAA/National Weather Service
Deviation between average and normal (°F)
7-Day Mean ending Aug 23, 2012
Source: NOAA/National Weather Service
Monthly dry shale gas production
billion cubic feet per day
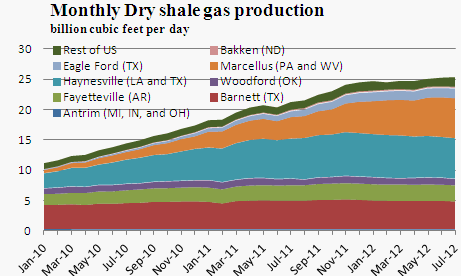
Source: Lippman Consulting, Inc. Gross withdrawal estimates are as of July 2012 and converted to dry production estimates with EIA-calculated average.