In the News:
Natural gas consumed for power generation (power burn) declined slightly for the report week, while remaining high for recent years.
After extremely hot temperatures last month receded some, natural gas demand for power generation decreased below last year's levels. Despite this week's declines, power burn this summer has been at historically high levels, partly because of a much warmer-than-normal July. In particular, the Southeast has shown large year-over-year increases in power burn. Southeast power burn peaked this summer at 12.5 billion cubic feet (Bcf) per day on July 26, according to BENTEK Energy LLC (Bentek) data.
According to NOAA, temperatures over much of the United States are forecasted to be above normal in the next weeks, which may result in a rebound of natural gas demand for power generation. NOAA predicts high temperatures in the 90s and above over much of the country in the next few days.
Overview:
(For the Week Ending Wednesday, August 1, 2012)
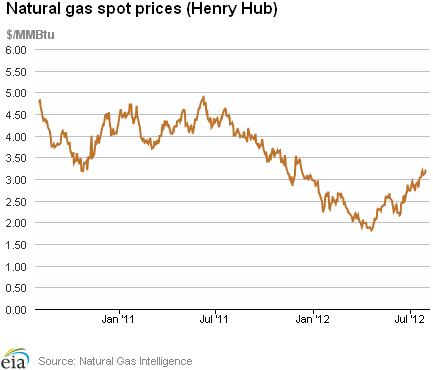
- Natural gas prices increased modestly for the report week (Wednesday to Wednesday) at many of the country's trading locations, with an exception at the Algonquin Citygate trading point (for delivery into Boston), which registered an increase of 39 cents per million British thermal units (MMBtu). The Henry Hub price closed at $3.20 per MMBtu, up 1 cent for the week.
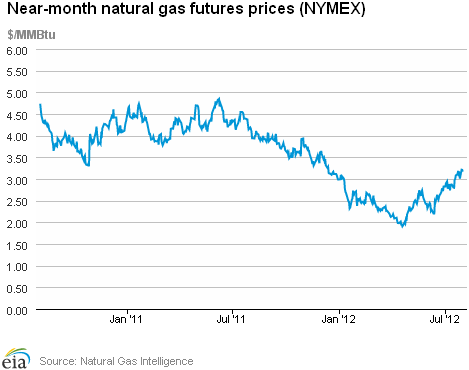
- The natural gas futures market trended steadily higher over the week. At the New York Mercantile Exchange (NYMEX), the September 2012 natural gas contract gained 12 cents per MMBtu to close at $3.171 per MMBtu yesterday.
- Working natural gas in storage rose last week to 3,217 Bcf as of Friday, July 27, according to the U.S. Energy Information Administration's (EIA) Weekly Natural Gas Storage Report (WNGSR). An implied storage build of 28 Bcf for the week positioned storage volumes 472 Bcf above year-ago levels.
- The natural gas rotary rig count, as reported by Baker Hughes Incorporated on July 27, declined by 13 to 505 active units. Meanwhile, oil-directed rigs increased by 2 to 1416 units.
Prices:
Natural gas prices increased modestly over the report week at most spot market locations. At most trading points across the country, spot prices increased less than a nickel for the week. Moderate temperatures in most regions over the week contributed to the low price variance. The largest price increase occurred at Algonquin Citygate trading point (for delivery into Boston), which increased by 11 percent from $3.58 per MMBtu last Wednesday to $3.97 per MMBtu yesterday. A forecast of warmer-than-normal temperatures for New England likely contributed to the increase.
The NYMEX September 2012 futures contract rose by 4 percent from $3.052 per MMBtu last Wednesday to $3.171 per MMBtu yesterday. The settlement price increased significantly on Monday to $3.214 per MMBtu, the highest level since January. The 12-Month Strip (average of August 2012 to July 2013 contracts) also increased by 3.7 percent over the same period from $3.412 per MMBtu last Wednesday to $3.539 per MMBtu yesterday.
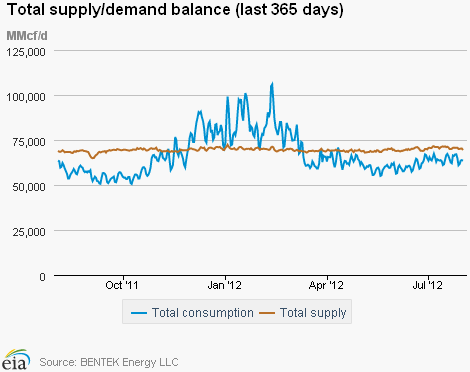
Total consumption for the report week registered an overall decrease, with slightly higher industrial sector demand being offset by decreases in other sectors. According to estimates from Bentek, domestic natural gas consumption declined by 2 percent from last week, driven by decreases in power, residential, and commercial demand. Industrial sector consumption increased slightly by 0.3 percent.
Total supply for the week was essentially unchanged, and registered a slight decrease of 0.3 percent, reflecting the drop in dry gas production. According to Bentek estimates, domestic weekly dry gas production was 0.1 percent lower than the previous week (although 3.2 percent above the same time last year). Imports from Canada decreased by 1.9 percent. Liquefied natural gas (LNG) sendout dropped sharply, down 10.7 percent from last week; sendout volumes remain well below (39 percent) year-ago levels.
Storage
Working natural gas in storage increased to 3,217 Bcf as of Friday, July 27, according to EIA's WNGSR. This represents an implied net injection of 28 Bcf from the previous week. This week's injection was 28 Bcf below the 5-year (2007-2011) injection of 56 Bcf, and 15 Bcf below last year's injection of 43 Bcf. Since April 27, injections of working natural gas into underground storage have fallen short of both year-ago levels and the 5-year average, although stocks remain well above historical levels. Inventories are currently 472 Bcf (17.2 percent) greater than last year at this time and 407 Bcf (14.5 percent) greater than the 5-year average.
Two of the three storage regions posted increases this week. Inventories in the East and West regions increased by 30 Bcf over the week (with the 5-year average net injection of 49 Bcf) and 4 Bcf (with the 5-year average net injection of 5 Bcf), respectively, while the Producing region posted a decrease of 6 Bcf in working gas stocks (with the 5-year average net injection of 3 Bcf). In the Producing Region, working natural gas inventories decreased 8 Bcf (3.3 percent) in salt cavern facilities and increased 3 Bcf (0.3 percent) in nonsalt cavern facilities.
Temperatures during the storage report week were 2.6 degrees warmer than the 30-year normal temperature and 1.9 degrees cooler than the same period last year. Temperatures in the lower 48 States averaged 77.9 degrees, compared to 79.7 last year and the 30-year normal of 75.3. While overall temperatures were a few degrees warmer than normal, temperatures varied somewhat across Census Divisions. The West North Central and East North Central Census divisions in the Midwest were particularly warm, averaging 6.4 and 4.9 degrees, respectively, warmer than the 30-year normal. Temperatures in the New England Census division were cool, averaging 0.7 degrees cooler than the 30-year normal.
See also:
Summer Power Burn, May 1 - September 30
billion cubic feet per day
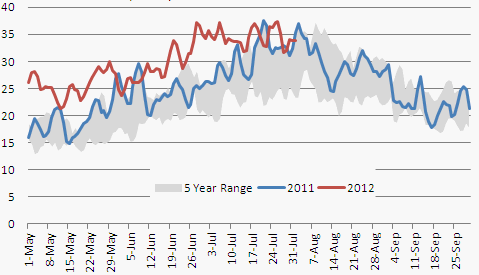
Source: Bentek Energy
Note: Shaded area represents the range between the maximum and minimum values between 2007 and 2011
| Spot Prices ($/MMBtu) | Thu, 26-Jul |
Fri, 27-Jul |
Mon, 30-Jul |
Tue, 31-Jul |
Wed, 01-Aug |
|---|---|---|---|---|---|
| Henry Hub | 3.13 |
3.10 |
3.14 |
3.20 |
3.20 |
| New York | 3.51 |
3.25 |
3.31 |
3.43 |
3.50 |
| Chicago | 3.18 |
3.11 |
3.22 |
3.30 |
3.26 |
| Cal. Comp. Avg,* | 3.05 |
2.96 |
3.08 |
3.16 |
3.16 |
| Futures ($/MMBtu) | |||||
| August Contract | 3.105 |
3.101 |
Expired |
Expired |
Expired |
| September Contract | 3.090 |
3.015 |
3.214 |
3.209 |
30171 |
| October Contract | 3.106 |
3.039 |
3.222 |
3.212 |
3.171 |
| *Avg. of NGI's reported prices for: Malin, PG&E citygate, and Southern California Border Avg. | |||||
| Source: NGI's Daily Gas Price Index | |||||
| U.S. Natural Gas Supply - Gas Week: (7/25/12 - 8/1/12) | ||
|---|---|---|
Percent change for week compared with: |
||
last year |
last week |
|
| Gross Production | 3.16%
|
-0.09%
|
| Dry Production | 3.18%
|
-0.09%
|
| Canadian Imports | -7.53%
|
-1.86%
|
| West (Net) | 9.41%
|
-2.15%
|
| MidWest (Net) | -18.24%
|
-1.35%
|
| Northeast (Net) | -16.80%
|
-2.52%
|
| LNG Imports | -38.96%
|
-10.68%
|
| Total Supply | 1.87%
|
-0.30%
|
| Source: BENTEK Energy LLC | ||
| U.S. Consumption - Gas Week: (7/25/12 - 8/1/12) | ||
|---|---|---|
Percent change for week compared with: |
||
last year |
last week |
|
| U.S. Consumption | 2.23%
|
-2.04%
|
| Power | 3.73%
|
-3.40%
|
| Industrial | 0.75%
|
0.32%
|
| Residential/Commercial | -0.51%
|
-1.28%
|
| Total Demand | 2.41%
|
-2.02%
|
| Source: BENTEK Energy LLC | ||
Weekly natural gas rig count and spot Henry Hub
active rigs$ per MMBtu
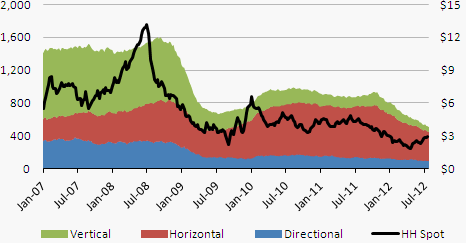
Source: Baker Hughes
| Rigs | |||
|---|---|---|---|
Fri, July 27, 2012 |
Change from |
||
last week |
last year |
||
| Oil Rigs | 1,416 |
0.14% |
38.15% |
| Natural Gas Rigs | 505 |
-2.51% |
-42.42% |
| Miscellaneous | 3 |
0.00% |
-50.00% |
| Rig Numbers by Type | |||
|---|---|---|---|
Fri, July 27, 2012 |
Change from |
||
last week |
last year |
||
| Vertical | 533 |
-1.48% |
-8.42% |
| Horizontal | 1,151 |
-1.12% |
6.57% |
| Directional | 240 |
4.35% |
-2.44% |
| Source: Baker Hughes Inc. | |||
| Working Gas in Underground Storage | ||||
|---|---|---|---|---|
Stocks billion cubic feet (bcf) |
||||
| Region | 7/27/12
|
7/20/12
|
change |
|
| East | 1,605 |
1,575 |
30
|
|
| West | 499 |
495 |
4
|
|
| Producing | 1,113 |
1,119 |
-6
|
|
| Total | 3,217 |
3,189 |
28
|
|
| Source: U.S. Energy Information Administration | ||||
| Working Gas in Underground Storage | |||||
|---|---|---|---|---|---|
Historical Comparisons |
|||||
Year ago (7/27/11) |
5-year average (2007-2011) |
||||
| Region | Stocks (Bcf) |
% change |
Stocks (Bcf) |
% change |
|
| East | 1,368 |
17.3 |
1,457 |
10.2 |
|
| West | 394 |
26.6 |
412 |
21.1 |
|
| Producing | 983 |
13.2 |
941 |
18.3 |
|
| Total | 2,745 |
17.2 |
2,810 |
14.5 |
|
| Source: U.S. Energy Information Administration | |||||
| Temperature -- Heating & Cooling Degree Days (week ending Jul 26) | ||||||||
|---|---|---|---|---|---|---|---|---|
HDD deviation from: |
CDD deviation from: |
|||||||
| Region | HDD Current |
normal |
last year |
CDD Current |
normal |
last year |
||
| New England | 2
|
0
|
2
|
40
|
-5
|
-35
|
||
| Middle Atlantic | 1
|
-2
|
1
|
64
|
5
|
-41
|
||
| E N Central | 0
|
-3
|
0
|
89
|
31
|
-11
|
||
| W N Central | 0
|
-3
|
0
|
114
|
42
|
9
|
||
| South Atlantic | 0
|
0
|
0
|
109
|
11
|
-22
|
||
| E S Central | 0
|
0
|
0
|
116
|
21
|
-3
|
||
| W S Central | 0
|
0
|
0
|
145
|
19
|
-14
|
||
| Mountain | 0
|
-3
|
0
|
92
|
12
|
7
|
||
| Pacific | 2
|
-2
|
-1
|
51
|
5
|
7
|
||
| United States | 1
|
-2
|
0
|
91
|
16
|
-13
|
||
|
Note: HDD = heating degree-day; CDD = cooling degree-day Source: National Oceanic and Atmospheric Administration | ||||||||
Average temperature (°F)
7-Day Mean ending Jul 26, 2012
Source: NOAA/National Weather Service
Deviation between average and normal (°F)
7-Day Mean ending Jul 26, 2012
Source: NOAA/National Weather Service
Monthly dry shale gas production
billion cubic feet per day
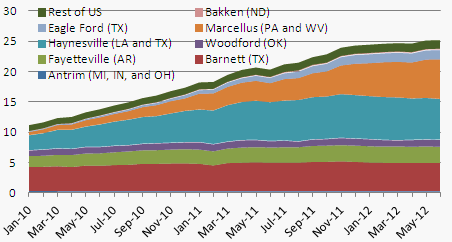
Source: Lippman Consulting, Inc. Gross withdrawal estimates are as of June 2012 and converted to dry production estimates with EIA-calculated average.