In the News:
U.S. Net Natural Gas Imports Through First Third of 2012 Lowest Since 1990
Through the first four months of 2012, U.S. net imports (imports minus exports) of natural gas averaged just 4.5 billion cubic feet (Bcf) per day, down 26 percent from the corresponding period in 2011 and the lowest first third-of-year average since 1990. On an annual basis, U.S. net natural gas imports rose gradually from the late 1980s and peaked at over 10 Bcf per day in 2007. However, net imports have fallen sharply, the result of reduced imports and growing exports driven largely by significantly increasing domestic production associated primarily with shale gas development.
Pipeline shipments from Canada are by far the leading source of U.S. natural gas imports. Liquefied natural gas (LNG) is an important secondary source, but higher natural gas prices in competing overseas markets are attracting spot LNG cargoes that can be delivered under flexible pricing terms.
Overview:
(For the Week Ending Wednesday, July 25, 2012)
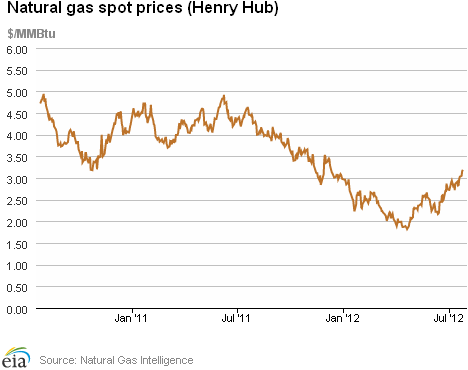
- Natural gas prices increased by double-digit amounts at most trading locations over the report week, with a few exceptions in the Northeast. The Henry Hub spot price rose from $2.84 per million British thermal units (MMBtu) at the beginning of the report week on July 18 to $3.19 per MMBtu on July 25.
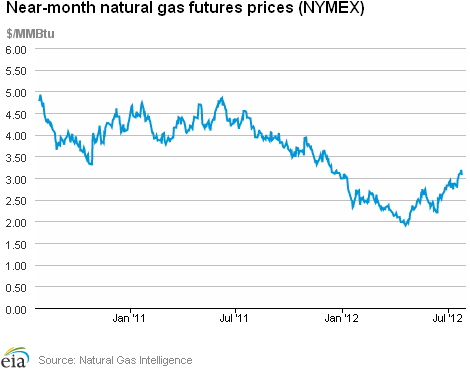
- At the New York Mercantile Exchange (NYMEX), the near-month (August 2012) natural gas contract rose 9.7 cents to $3.07 per MMBtu.
- Working natural gas in storage rose last week to 3,189 billion cubic feet (Bcf) as of Friday, July 20, according to the U.S. Energy Information Administration's (EIA) Weekly Natural Gas Storage Report (WNGSR). An implied storage build of 26 Bcf for the week positioned storage volumes 487 Bcf above year-ago levels.
- The natural gas rotary rig count, as reported July 20 by Baker Hughes Incorporated, fell by 4 to 518. The oil rig count fell by 13 to 1,414.
Prices:
Natural gas prices rose over the report week at most spot market locations. The Henry Hub price increased from $2.84 per MMBtu last Wednesday to $3.19 per MMBtu yesterday. The largest price increases occurred in the Rocky Mountain area; for example, the spot price at the Opal Hub in Wyoming rose 51 cents from $2.48 per MMBtu last Wednesday to $2.99 yesterday. Various trade press and analysis reports have cited infrastructure issues in the price increases in the Rockies. A number of recent maintenance projects in the Rockies have limited outflow capacity, and recovery from maintenance provided support for prices.
Prices at a few Northeast trading points, particularly Tennessee Pipeline's Zone 4, fell during the week, reflecting infrastructure constraints. This week, spot prices at Tennessee's Zone 4 in the Marcellus Shale dropped from $1.84 per MMBtu last Wednesday to $1.39 per MMBtu yesterday. Prices at this trading point have, in the past several months, diverged from Henry Hub prices as Marcellus natural gas production has outpaced available takeaway capacity.
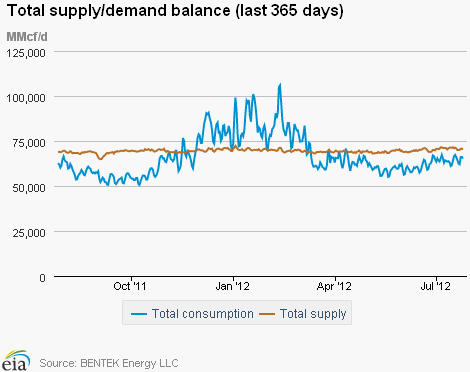
This report week marked the first time in 2012 that Henry Hub prices crossed the $3 per MMBtu threshold. Spot prices have generally risen since the end of April, and particularly from mid-June to the present, as demand for natural gas for power generation increased to meet air-conditioning needs. More natural gas power generation capacity has come online in recent years, and extreme heat and relatively low natural gas prices have pushed gas for power generation to historically high levels this summer. Power burn this week averaged 34.9 Bcf per day, 2.3 percent greater than last week and 1.8 percent greater than the corresponding week last year, according to data from BENTEK Energy LLC (Bentek). This week in the Southeast, the region's power burn exceeded last week's by 11.1 percent and the same week last year by 18.2 percent.
Total consumption for the week was up 1.2 percent, according to data from Bentek. Increases in power burn offset declines in residential, commercial, and industrial demand. While still at high levels, total supply fell this week, with dry production dropping 0.7 percent from the previous week. Total supply was down 1.2 percent, with declines in imports from Canada also contributing to the week-over-week declines.
The NYMEX August 2012 futures contract ended the week at $3.070 per MMBtu, a 3.3 percent increase over the previous Wednesday's price of $2.973 per MMBtu. The 12-month strip (the average of the 12 contracts between August 2012 and July 2013) rose slightly (1.6 percent), from $3.359 per MMBtu last Wednesday to $3.412 per MMBtu yesterday.
Storage
Working natural gas in storage increased to 3,189 Bcf as of Friday, July 20, according to EIA's WNGSR. This represents an implied net injection of 26 Bcf from the previous week. This week's injection was 35 Bcf below the 5-year (2007-2011) injection of 61 Bcf, and 22 Bcf below last year's injection of 48 Bcf. Since April 27, injections of working natural gas into underground storage have fallen short of both year-ago levels and the 5-year average, although stocks remain well above historical levels. Inventories are currently 487 Bcf (18 percent) greater than last year at this time and 435 Bcf (15.8 percent) greater than the 5-year average.
Two of the three storage regions posted increases this week. Inventories in the East and West regions increased by 20 Bcf (with the 5-year average net injection of 51 Bcf) and 7 Bcf (with the 5-year average net injection of 5 Bcf), respectively. The Producing region posted a decrease of 1 Bcf in working gas stocks (with the 5-year average net injection of 4 Bcf). In the Producing Region, working natural gas inventories decreased 5 Bcf (2.1 percent) in salt cavern facilities and increased 4 Bcf (0.5 percent) in nonsalt cavern facilities.
Temperatures during the storage report week were 3.0 degrees warmer than the 30-year normal temperature and 0.9 degrees warmer than the same period last year. Temperatures in the lower 48 States averaged 78.3 degrees, compared to 77.4 last year and the 30-year normal of 75.3. During the week all regions were warmer than normal, particularly the East North Central and New England Census divisions, which averaged 6.6 and 6.0 degrees, respectively, warmer than the 30-year normal.
See also:
U.S. annual natural gas consumption, production, and net imports
billion cubic feet per day
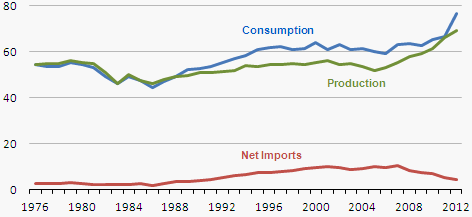
Source: U.S. Energy Information Administration; 2012 is through April
| Spot Prices ($/MMBtu) | Thu, 19-Jul |
Fri, 20-Jul |
Mon, 23-Jul |
Tue, 24-Jul |
Wed, 25-Jul |
|---|---|---|---|---|---|
| Henry Hub | 2.99 |
3.03 |
3.05 |
3.16 |
3.19 |
| New York | 3.14 |
3.17 |
3.29 |
3.37 |
3.46 |
| Chicago | 3.04 |
3.09 |
3.11 |
3.23 |
3.23 |
| Cal. Comp. Avg,* | 2.86 |
2.92 |
2.98 |
3.09 |
3.13 |
| Futures ($/MMBtu) | |||||
| August Contract | 2.999 |
3.081 |
3.117 |
3.187 |
3.070 |
| September Contract | 2.981 |
3.076 |
3.111 |
3.177 |
3.052 |
| *Avg. of NGI's reported prices for: Malin, PG&E citygate, and Southern California Border Avg. | |||||
| Source: NGI's Daily Gas Price Index | |||||
| U.S. Natural Gas Supply - Gas Week: (7/18/12 - 7/25/12) | ||
|---|---|---|
Percent change for week compared with: |
||
last year |
last week |
|
| Gross Production | 2.29%
|
-0.67%
|
| Dry Production | 2.30%
|
-0.68%
|
| Canadian Imports | -15.43%
|
-6.82%
|
| West (Net) | 6.48%
|
3.64%
|
| MidWest (Net) | -16.32%
|
-5.91%
|
| Northeast (Net) | -50.08%
|
-32.94%
|
| LNG Imports | -50.24%
|
3.44%
|
| Total Supply | -0.03%
|
-1.24%
|
| Source: BENTEK Energy LLC | ||
| U.S. Consumption - Gas Week: (7/18/12 - 7/25/12) | ||
|---|---|---|
Percent change for week compared with: |
||
last year |
last week |
|
| U.S. Consumption | 0.85%
|
0.94%
|
| Power | 1.84%
|
2.27%
|
| Industrial | 1.47%
|
-0.10%
|
| Residential/Commercial | -3.80%
|
-2.23%
|
| Total Demand | 1.38%
|
1.16%
|
| Source: BENTEK Energy LLC | ||
Weekly natural gas rig count and spot Henry Hub
active rigs$ per MMBtu

Source: Baker Hughes
| Rigs | |||
|---|---|---|---|
Fri, July 20, 2012 |
Change from |
||
last week |
last year |
||
| Oil Rigs | 1,414 |
-0.91% |
38.49% |
| Natural Gas Rigs | 518 |
-0.77% |
-41.73% |
| Miscellaneous | 3 |
-25.00% |
-50.00% |
| Rig Numbers by Type | |||
|---|---|---|---|
Fri, July 20, 2012 |
Change from |
||
last week |
last year |
||
| Vertical | 541 |
-2.52% |
-5.09% |
| Horizontal | 1,164 |
-0.17% |
5.63% |
| Directional | 230 |
-0.86% |
-5.74% |
| Source: Baker Hughes Inc. | |||
| Working Gas in Underground Storage | ||||
|---|---|---|---|---|
Stocks billion cubic feet (bcf) |
||||
| Region | 7/20/12
|
7/13/12
|
change |
|
| East | 1,575 |
1,555 |
20
|
|
| West | 495 |
488 |
7
|
|
| Producing | 1,119 |
1,120 |
-1
|
|
| Total | 3,189 |
3,163 |
26
|
|
| Source: U.S. Energy Information Administration | ||||
| Working Gas in Underground Storage | |||||
|---|---|---|---|---|---|
Historical Comparisons |
|||||
Year ago (7/20/11) |
5-year average (2007-2011) |
||||
| Region | Stocks (Bcf) |
% change |
Stocks (Bcf) |
% change |
|
| East | 1,327 |
18.7 |
1,408 |
11.9 |
|
| West | 386 |
28.2 |
407 |
21.6 |
|
| Producing | 989 |
13.1 |
938 |
19.3 |
|
| Total | 2,702 |
18.0 |
2,754 |
15.8 |
|
| Source: U.S. Energy Information Administration | |||||
| Temperature -- Heating & Cooling Degree Days (week ending Jul 19) | ||||||||
|---|---|---|---|---|---|---|---|---|
HDD deviation from: |
CDD deviation from: |
|||||||
| Region | HDD Current |
normal |
last year |
CDD Current |
normal |
last year |
||
| New England | 0
|
-1
|
-1
|
84
|
41
|
31
|
||
| Middle Atlantic | 0
|
-1
|
0
|
92
|
34
|
17
|
||
| E N Central | 0
|
-1
|
-1
|
102
|
45
|
10
|
||
| W N Central | 0
|
-3
|
0
|
110
|
38
|
-7
|
||
| South Atlantic | 0
|
0
|
0
|
109
|
12
|
9
|
||
| E S Central | 0
|
0
|
0
|
105
|
11
|
1
|
||
| W S Central | 0
|
0
|
0
|
125
|
1
|
-26
|
||
| Mountain | 0
|
-4
|
0
|
77
|
-2
|
-7
|
||
| Pacific | 1
|
-3
|
-3
|
42
|
-1
|
11
|
||
| United States | 0
|
-2
|
-1
|
93
|
19
|
5
|
||
|
Note: HDD = heating degree-day; CDD = cooling degree-day Source: National Oceanic and Atmospheric Administration | ||||||||
Average temperature (°F)
7-Day Mean ending Jul 19, 2012
Source: NOAA/National Weather Service
Deviation between average and normal (°F)
7-Day Mean ending Jul 19, 2012
Source: NOAA/National Weather Service
Monthly dry shale gas production
billion cubic feet per day
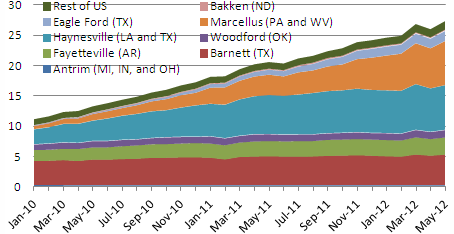
Source: Lippman Consulting, Inc. Gross withdrawal estimates are as of May 2012 and converted to dry production estimates with EIA-calculated average.