In the News:
Tropical Storm Debby Shuts In Gulf of Mexico Production
Offshore oil and natural gas platform operators evacuated rigs and shut in production this week in response to Tropical Storm Debby (later downgraded to a tropical depression). According to the Bureau of Safety and Environmental Enforcement (BSEE), 17.1 percent of natural gas production from the Gulf of Mexico was shut in on Tuesday morning. This amounts to about 773 million cubic feet (MMcf) per day. About 250,000 barrels per day of oil were reported as shut in on Tuesday, about 18.1 percent of Gulf of Mexico crude oil production.
Most shut-ins occurred Sunday and Monday, and when most production had returned to normal on Wednesday, BSEE issued its final update on oil and gas activity. After moving across the Gulf, Debby made landfall in Florida on Tuesday afternoon.
Overview:
(For the Week Ending Wednesday, June 27, 2012)
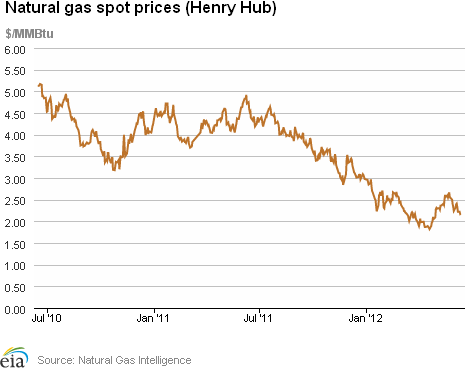
- Natural gas prices generally registered overall increases for the report week (Wednesday to Wednesday) at many of the country's trading locations. The Henry Hub price, which dropped 12 cents per million British thermal units (MMBtu) on Thursday, rose sharply on Monday and again yesterday to close at $2.87 per MMBtu (up 27 cents for the week).
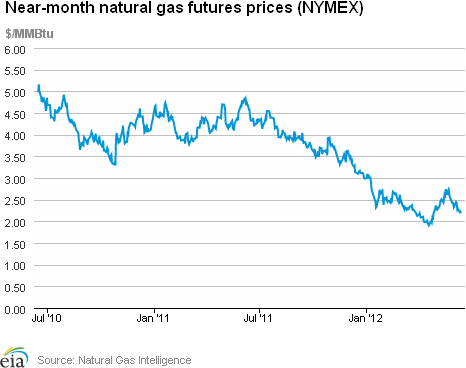
- The natural gas futures market trended steadily higher over the week. At the New York Mercantile Exchange (NYMEX), the July 2012 natural gas contract gained 25.7 cents per MMBtu to close at $2.774 per MMBtu yesterday.
- Working natural gas in storage rose last week to 3,063 billion cubic feet (Bcf) as of Friday, June 22, according to the U.S. Energy Information Administration's (EIA) Weekly Natural Gas Storage Report (WNGSR). An implied storage build of 57 Bcf for the week positioned storage volumes 653 Bcf above year-ago levels.
- The natural gas rotary rig count, as reported by Baker Hughes Incorporated on June 22, declined by 21 to 541 active units. Meanwhile, oil-directed rigs increased by 16 to 1,421 units.
Prices:
The Henry Hub day-ahead price registered an overall increase for the week, dipping on Thursday before climbing modestly on Friday and then sharply increasing on Monday and Wednesday, closing the week at $2.87 per MMBtu, up 10.4 percent. Shut-in production in the Gulf of Mexico (due to tropical storm Debby) contributed to Monday's increase. In the northeast, the much hotter-than-normal temperatures (combined with pipeline maintenance and nuclear outages) that helped generate significant price increases early in the reporting week was followed by cooler weather that helped to moderate end-of-week prices.
At the NYMEX, the July 2012 contract, which expired yesterday, ended the week higher, rising from $2.517 per MMBtu last Wednesday to $2.774 per MMBtu yesterday, an increase of 10.2 percent. Prices rose every day to close 25.7 cents per MMBtu higher, reflecting, in part, an anticipated return to above-normal temperatures for several parts of the nation. The August contract, which moves into the near-month position today, rose from $2.555 per MMBtu last Wednesday to $2.798 per MMBtu yesterday. The 12-Month Strip (average of July 2012 to June 2013 contracts) rose every day of the reporting period before dipping yesterday, closing at $3.207 per MMBtu, up 14.8 cents per MMBtu (4.8 percent) for the week.
Prices at many downstream trading locations recorded overall increases, dropping on Thursday and Friday before rebounding toward the end of the week. In the northeast, however, certain locations saw prices ending lower due to high start-of-week prices. For example, at the Algonquin Citygate trading point (for delivery into Boston), where temperatures approached 100 degrees, spot prices started the week at $8.87 per MMBtu, fell to $2.98 per MMBtu on Friday and then rose for the remainder of the period (in part due to pipeline maintenance that had been postponed earlier in the week) to close yesterday at a relatively high $5.58 per MMBtu (down 37.1 percent for the week). Prices at the Transcontinental Pipeline's Zone 6 trading point (which serves New York City markets) declined from $4.11 per MMBtu last Wednesday (when temperatures peaked in the mid-90s) to $2.61 per MMBtu on Friday, then climbed to $3.17 per MMBtu by week's end (down 22.9 percent).
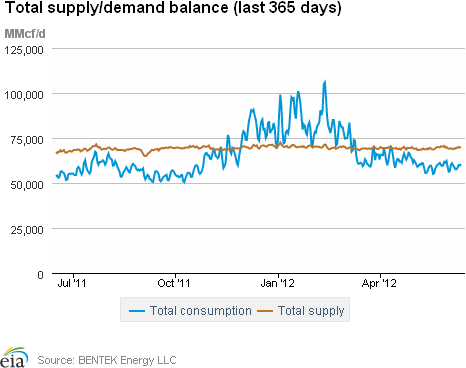
Total consumption for the report week registered an overall increase, with higher power sector demand offsetting decreases in other sectors. According to estimates from BENTEK Energy LLC (Bentek), domestic natural gas consumption rose by 1.7 percent from last week, driven by an increase of 4.7 percent in power sector consumption. Residential/commercial and industrial sector consumption ended the week down 2.8 percent and 1.0 percent, respectively. For the power sector, consumption exceeded levels for the same week last year by 28.5 percent.
Total supply for the week registered an overall decline of 0.7 percent, reflecting a similar percentage drop in dry gas production. According to Bentek estimates, domestic weekly dry gas production was also 0.7 percent lower than the previous week (although 3.2 percent above the same time last year). Imports from Canada rose modestly (0.9 percent), with increases in shipments to the west and northeast offsetting declines in the midwest. For the week, imports from Canada stand 17.2 percent above year-ago volumes. Liquefied natural gas (LNG) sendout dropped sharply, down 29.4 percent from last week; sendout volumes remain well below (62.2 percent) year-ago levels.
Storage
Working natural gas in storage increased to 3,063 Bcf as of Friday, June 22, according to EIA's WNGSR. This represents an implied net injection of 57 Bcf from the previous week. This week's injection was 28 Bcf below the 5-year (2007-2011) injection of 85 Bcf, and 27 Bcf below last year's injection of 84 Bcf. Since April 20, injections of working natural gas into underground storage have fallen short of both year-ago levels and the 5-year average, although stocks remain well above historical levels. Inventories are currently 653 Bcf greater than last year at this time and 613 Bcf greater than the 5-year average.
Injections in the East and West storage regions were below the five-year average. The East region injected 34 Bcf (compared to the 5-year average of 59); the West injected 9 Bcf (compared to the 5-year averaged of 12); and the Producing region injected 14 Bcf (compared to the 5-year average of 14). In the Producing region, stocks increased 2 Bcf in salt cavern facilities and 11 Bcf in non-salt cavern facilities.
Temperatures during the storage report week were 2.7 degrees warmer than the 30-year normal temperature and 0.6 degrees warmer than the same period last year. Temperatures in the lower 48 States averaged 74 degrees, compared to 73.4 last year and the 30-year normal of 71.3. The warmest area of the country was the West South Central Census division (Arkansas, Louisiana, Oklahoma, and Texas), where temperatures averaged 80.9 degrees.
See also:
Offshore Gulf Production By State, June 21 - 27
million cubic feet
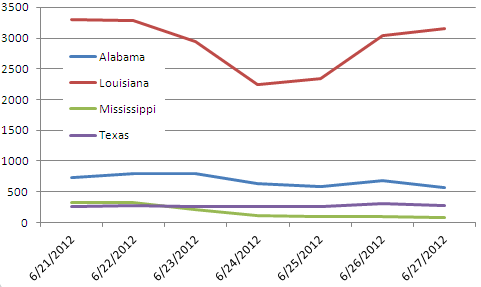
Source: Bentek Energy
| Spot Prices ($/MMBtu) | Thu, 21-Jun |
Fri, 22-Jun |
Mon, 25-Jun |
Tue, 26-Jun |
Wed, 27-Jun |
|---|---|---|---|---|---|
| Henry Hub | 2.48 |
2.50 |
2.70 |
2.70 |
2.87 |
| New York | 3.09 |
2.61 |
2.82 |
2.84 |
3.17 |
| Chicago | 2.51 |
2.53 |
2.75 |
2.74 |
2.96 |
| Cal. Comp. Avg,* | 2.62 |
2.61 |
2.75 |
2.73 |
2.89 |
| Futures ($/MMBtu) | |||||
| July Contract | 2.582 |
2.625 |
2.694 |
2.767 |
2.774 |
| August Contract | 2.618 |
2.668 |
2.734 |
2.807 |
2.798 |
| *Avg. of NGI's reported prices for: Malin, PG&E citygate, and Southern California Border Avg. | |||||
| Source: NGI's Daily Gas Price Index | |||||
| U.S. Natural Gas Supply - Gas Week: (6/20/12 - 6/27/12) | ||
|---|---|---|
Percent change for week compared with: |
||
last year |
last week |
|
| Gross Production | 3.18%
|
-0.73%
|
| Dry Production | 3.20%
|
-0.74%
|
| Canadian Imports | 17.23%
|
1.17%
|
| West (Net) | 10.39%
|
0.94%
|
| MidWest (Net) | 14.97%
|
-3.24%
|
| Northeast (Net) | 47.52%
|
13.14%
|
| LNG Imports | -62.24%
|
-29.42%
|
| Total Supply | 3.63%
|
-0.72%
|
| Source: BENTEK Energy LLC | ||
| U.S. Consumption - Gas Week: (6/20/12 - 6/27/12) | ||
|---|---|---|
Percent change for week compared with: |
||
last year |
last week |
|
| U.S. Consumption | 13.01%
|
1.65%
|
| Power | 28.52%
|
4.70%
|
| Industrial | -0.54%
|
-0.95%
|
| Residential/Commercial | -1.04%
|
-2.85%
|
| Total Demand | 13.09%
|
1.56%
|
| Source: BENTEK Energy LLC | ||
Weekly natural gas rig count and spot Henry Hub
active rigs$ per MMBtu
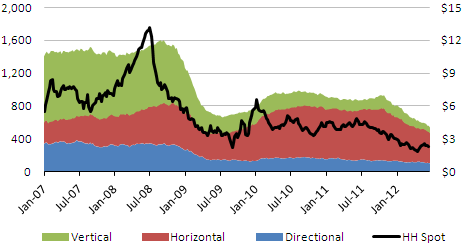
Source: Baker Hughes
| Rigs | |||
|---|---|---|---|
Fri, June 22, 2012 |
Change from |
||
last week |
last year |
||
| Oil Rigs | 1,421 |
1.14% |
41.67% |
| Natural Gas Rigs | 541 |
-3.74% |
-38.03% |
| Miscellaneous | 4 |
0.00% |
-33.33% |
| Rig Numbers by Type | |||
|---|---|---|---|
Fri, June 22, 2012 |
Change from |
||
last week |
last year |
||
| Vertical | 568 |
-1.39% |
0.53% |
| Horizontal | 1,165 |
0.26% |
7.77% |
| Directional | 233 |
0.00% |
-1.27% |
| Source: Baker Hughes Inc. | |||
| Working Gas in Underground Storage | ||||
|---|---|---|---|---|
Stocks billion cubic feet (bcf) |
||||
| Region | 6/22/12
|
6/15/12
|
change |
|
| East | 1,477 |
1,443 |
34
|
|
| West | 456 |
447 |
9
|
|
| Producing | 1,130 |
1,116 |
14
|
|
| Total | 3,063 |
3,006 |
57
|
|
| Source: U.S. Energy Information Administration | ||||
| Working Gas in Underground Storage | |||||
|---|---|---|---|---|---|
Historical Comparisons |
|||||
Year ago (6/22/11) |
5-year average (2007-2011) |
||||
| Region | Stocks (Bcf) |
% change |
Stocks (Bcf) |
% change |
|
| East | 1,111 |
32.9 |
1,189 |
24.2 |
|
| West | 331 |
37.8 |
372 |
22.6 |
|
| Producing | 967 |
16.9 |
890 |
27.0 |
|
| Total | 2,410 |
27.1 |
2,450 |
25.0 |
|
| Source: U.S. Energy Information Administration | |||||
| Temperature -- Heating & Cooling Degree Days (week ending Jun 21) | ||||||||
|---|---|---|---|---|---|---|---|---|
HDD deviation from: |
CDD deviation from: |
|||||||
| Region | HDD Current |
normal |
last year |
CDD Current |
normal |
last year |
||
| New England | 20
|
11
|
14
|
27
|
11
|
13
|
||
| Middle Atlantic | 3
|
-2
|
2
|
44
|
14
|
6
|
||
| E N Central | 0
|
-8
|
-3
|
84
|
47
|
41
|
||
| W N Central | 1
|
-7
|
-5
|
71
|
23
|
23
|
||
| South Atlantic | 0
|
0
|
0
|
71
|
-7
|
-26
|
||
| E S Central | 0
|
0
|
0
|
82
|
9
|
-8
|
||
| W S Central | 0
|
0
|
0
|
111
|
6
|
-36
|
||
| Mountain | 5
|
-13
|
-15
|
71
|
14
|
19
|
||
| Pacific | 6
|
-8
|
-1
|
33
|
9
|
9
|
||
| United States | 3
|
-5
|
-1
|
66
|
14
|
3
|
||
|
Note: HDD = heating degree-day; CDD = cooling degree-day Source: National Oceanic and Atmospheric Administration | ||||||||
Average temperature (°F)
7-Day Mean ending Jun 21, 2012
Source: NOAA/National Weather Service
Deviation between average and normal (°F)
7-Day Mean ending Jun 21, 2012
Source: NOAA/National Weather Service
Monthly dry shale gas production
billion cubic feet per day
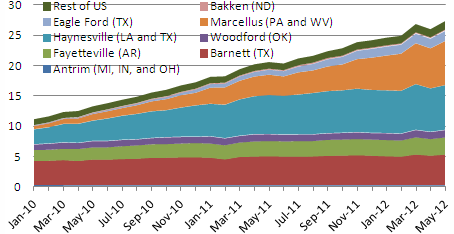
Source: Lippman Consulting, Inc. Gross withdrawal estimates are as of May 2012 and converted to dry production estimates with EIA-calculated average.