In the News:
Natural Gas Rigs Decline in Key Areas
Active natural gas rotary rigs currently total 594, according to the latest weekly data released by Baker Hughes Incorporated. According to Baker Hughes data, natural gas-directed horizontal rigs have driven the decline in total natural gas rigs over the past several months. Horizontal-directed natural gas rig counts have fallen to 411, from levels in the low-600s a year ago.
Declines have occurred in key areas of dry shale gas production, particularly in Louisiana, where the Haynesville Shale is located. The number of horizontal natural gas rigs drilling in Louisiana has fallen from 110 at the beginning of 2011 to 30 last week, according to Baker Hughes data. -Over the same time period, directional and vertical natural gas rig counts have remained relatively unchanged, and totaled 26 and 19, respectively, as of May 25. Other states that have seen significant declines in natural gas rigs include Texas and Oklahoma.
Overview:
(For the Week Ending Wednesday, May 30, 2012)
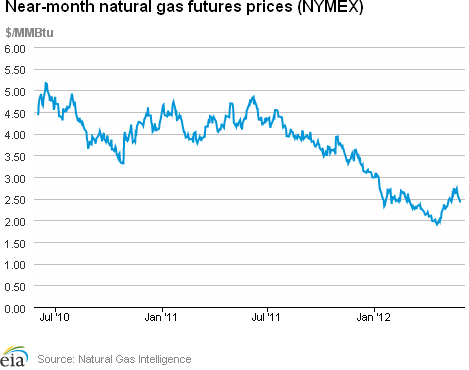
- The natural gas futures market trended lower over the report week (Wednesday to Wednesday). At the New York Mercantile Exchange (NYMEX), the June 2012 natural gas contract declined steadily, losing 30.8 cents per million British thermal units (MMBtu) to settle at $2.429 per MMBtu, prior to its expiration at the close of trading on Tuesday. The July 2012 natural gas contract (which moved into the near-month position yesterday), also declined steadily, ending the week down 37.8 cents per MMBtu to close at $2.418 per MMBtu yesterday.
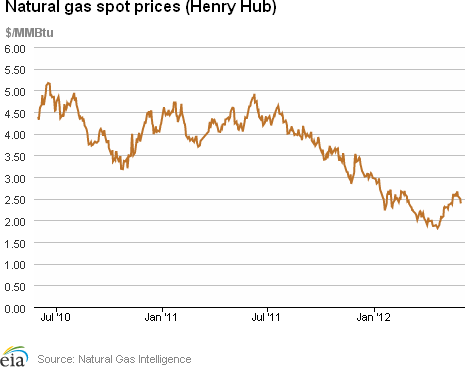
- Nearly all trading points across the country registered declines over the week. The Henry Hub price closed at $2.39 per MMBtu yesterday, down 21 cents per MMBtu from last Wednesday's $2.60 close.
- Working natural gas in storage rose last week to 2,815 billion cubic feet (Bcf) as of Friday, May 25, according to the U.S. Energy Information Administration's (EIA) Weekly Natural Gas Storage Report (WNGSR) An implied storage build of 71 Bcf for the week positioned storage volumes 732 Bcf above year-ago levels.
- The natural gas rotary rig count, as reported by Baker Hughes Incorporated on May 25, declined by 6 to 594 active units. Meanwhile, oil-directed rigs increased by 1 to 1,383 units.
Prices:
Movement in the Henry Hub day-ahead price reflected an overall decline in this week's cash market prices, falling 8.1 percent, from $2.60 per MMBtu last Wednesday to $2.39 per MMBtu yesterday. Prices at most trading points across the country initially increased, with average gains last Thursday in the 7 cent per MMBtu range. The gains were quickly given up on Friday as prices began an overall decline that continued through the remainder of the report week. The Henry Hub price increased to $2.67 per MMBtu on Thursday, retreated to $2.56 per MMBtu on Friday, and subsequently continued the downward slide for the remainder of the week.
At the NYMEX, the June 2012 contract expired on Tuesday at $2.429 per MMBtu, down 30.8 cents (11.3 percent) from $2.737 per MMBtu last Wednesday. The 12-Month Strip (average of the June 2012 through May 2013 contracts) also declined, losing 22.7 cents (7.1 percent) over the week to close at $2.961 per MMBtu. The July contract, which moved into the near-month position yesterday, lost 13.5 percent over the week, declining from $2.796 per MMBtu last Wednesday to $2.418 per MMBtu yesterday.
Despite a 3.5 percent increase in consumption over the week, nearly all downstream trading locations closed the week lower. Spot prices at Transcontinental Pipeline's Zone 6 trading point for delivery into New York City, which started the week at $2.77 per MMBtu, closed yesterday at $2.59 per MMBtu, down 18 cents per MMBtu (6.5 percent) over the week. The Chicago citygate spot price registered a 15-cent (5.7 percent) per MMBtu decline, starting the week at $2.62 per MMBtu last Wednesday and ending the week at $2.47 per MMBtu yesterday. The Algonquin city gate price for delivery into Boston closed the week with a 13 cent (4.6 percent) per MMBtu decline. The Algonquin city gate pricing point started the week at $2.83 per MMBtu, jumped 11 cents on Thursday to $2.94 per MMBtu, declined to $2.80 per MMBtu on Friday, and continued the slide for the remainder of the week.
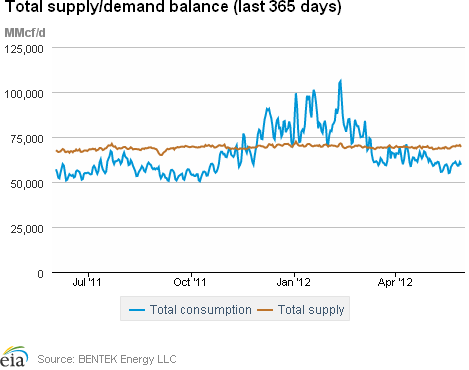
Total consumption exceeded that of last week, led by strong growth in power burn across most of the country. According to estimates from BENTEK Energy LLC (Bentek), domestic natural gas consumption increased by 3.5 percent from last week. While industrial and residential/commercial consumption declined by 1.8 and 8.2 percent, respectively, consumption for power generation jumped by 13.2 percent. With the exception of the Rockies, the Pacific Northwest, and the Southwest, all areas of the country registered power burn increases of more than 10 percent. Power burn for the past week stands 32.1 percent above the same week last year.
Total supply was up for the week, with increases in dry gas production, imports from Canada, and LNG sendout. According to Bentek estimates, the week's average total natural gas supply posted a 1.4 percent increase from last week's level, led by a 9.3 percent increase in imports from Canada, which averaged 5.6 Bcf per day over the week. Imports from Canada stand 13.6 percent above year-ago volumes for the same week. There was a slight (0.5 percent) increase in liquefied natural gas (LNG) supply over last week, with sendout averaging 371 million cubic feet (MMcf) per day. LNG's contribution to total supply remains minimal, however, with sendout volumes 67.8 percent below year-ago levels. Domestic dry gas production posted a 0.7 percent increase and averaged 64.1 Bcf per day, 3.9 percent above this time last year.
Storage
Working natural gas in storage increased to 2,815 Bcf as of Friday, May 25, according to EIA's WNGSR. This represents a net injection of 71 Bcf from the previous week. This week's injection was 29 Bcf lower than the 5-year (2007-2011) average injection for the same week. During the same week last year, the implied net injection was 89 Bcf. Working inventories are currently 732 Bcf (35 percent) greater than their year-ago levels and 724 Bcf (35 percent) greater than the 5-year average.
All three storage regions posted increases this week. Inventories in the East, West, and Producing Regions increased by 44 Bcf, 11 Bcf, and 16 Bcf, respectively. In the Producing Region, working natural gas inventories increased 4 Bcf in salt cavern facilities and increased 12 Bcf in nonsalt cavern facilities.
Temperatures in the lower 48 States during the week ending May 24 were 3.6 degrees warmer than the 30-year normal temperature and 1.6 degrees warmer than the same period last year. The average temperature in the lower 48 States was 67.6 degrees, 3.6 degrees higher than the 30-year normal of 64.0 degrees. During the week all regions were warmer than normal, particularly the West North Central and East North Central Regions in the Midwest, which averaged 5.3 and 5.0 degrees, respectively, warmer than the 30-year normal.
See also:
Natural Gas Rigs, 2011 - 2012
number of rigs
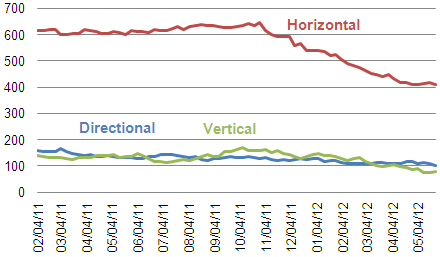
Source: Baker Hughes Incorporated
| Spot Prices ($/MMBtu) | Thu, 24-May |
Fri, 25-May |
Mon, 28-May |
Tue, 29-May |
Wed, 30-May |
|---|---|---|---|---|---|
| Henry Hub | 2.67 |
2.56 |
Holiday |
2.50 |
2.39 |
| New York | 2.86 |
2.78 |
Holiday |
2.73 |
2.59 |
| Chicago | 2.68 |
2.55 |
Holiday |
2.54 |
2.47 |
| Cal. Comp. Avg,* | 2.74 |
2.57 |
Holiday |
2.59 |
2.49 |
| Futures ($/MMBtu) | |||||
| June Contract | 2.647 |
2.568 |
Holiday |
2.429 |
expired |
| July Contract | 2.709 |
2.627 |
Holiday |
2.485 |
2.418 |
| August Contract | 2.754 |
2.678 |
Holiday |
2.540 |
2.471 |
| *Avg. of NGI's reported prices for: Malin, PG&E citygate, and Southern California Border Avg. | |||||
| Source: NGI's Daily Gas Price Index | |||||
| U.S. Natural Gas Supply - Gas Week: (5/23/12 - 5/30/12) | ||
|---|---|---|
Percent change for week compared with: |
||
last year |
last week |
|
| Gross Production | 3.86%
|
0.73%
|
| Dry Production | 3.88%
|
0.73%
|
| Canadian Imports | 13.63%
|
9.34%
|
| West (Net) | 7.09%
|
-3.24%
|
| MidWest (Net) | 15.93%
|
14.12%
|
| Northeast (Net) | 30.81%
|
51.80%
|
| LNG Imports | -67.78%
|
0.46%
|
| Total Supply | 3.37%
|
1.37%
|
| Source: BENTEK Energy LLC | ||
| U.S. Consumption - Gas Week: (5/23/12 - 5/30/12) | ||
|---|---|---|
Percent change for week compared with: |
||
last year |
last week |
|
| U.S. Consumption | 10.57%
|
3.54%
|
| Power | 32.11%
|
13.20%
|
| Industrial | -0.96%
|
-1.83%
|
| Residential/Commercial | -9.83%
|
-8.21%
|
| Total Demand | 10.57%
|
3.59%
|
| Source: BENTEK Energy LLC | ||
Weekly natural gas rig count and spot Henry Hub
active rigs$ per MMBtu
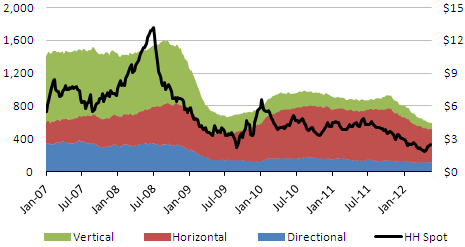
Source: Baker Hughes
| Rigs | |||
|---|---|---|---|
Fri, May 25, 2012 |
Change from |
||
last week |
last year |
||
| Oil Rigs | 1,383 |
0.07% |
44.36% |
| Natural Gas Rigs | 594 |
-1.00% |
-32.58% |
| Miscellaneous | 6 |
50.00% |
-25.00% |
| Rig Numbers by Type | |||
|---|---|---|---|
Fri, May 25, 2012 |
Change from |
||
last week |
last year |
||
| Vertical | 570 |
0.71% |
1.60% |
| Horizontal | 1,191 |
-0.17% |
13.00% |
| Directional | 222 |
-2.20% |
-4.31% |
| Source: Baker Hughes Inc. | |||
| Working Gas in Underground Storage | ||||
|---|---|---|---|---|
Stocks billion cubic feet (bcf) |
||||
| Region | 5/25/12
|
5/18/12
|
change |
|
| East | 1,325 |
1,281 |
44
|
|
| West | 410 |
399 |
11
|
|
| Producing | 1,080 |
1,064 |
16
|
|
| Total | 2,815 |
2,744 |
71
|
|
| Source: U.S. Energy Information Administration | ||||
| Working Gas in Underground Storage | |||||
|---|---|---|---|---|---|
Historical Comparisons |
|||||
Year ago (5/25/11) |
5-year average (2007-2011) |
||||
| Region | Stocks (Bcf) |
% change |
Stocks (Bcf) |
% change |
|
| East | 896 |
47.9 |
957 |
38.5 |
|
| West | 272 |
50.7 |
316 |
29.7 |
|
| Producing | 915 |
18.0 |
817 |
32.2 |
|
| Total | 2,083 |
35.1 |
2,091 |
34.6 |
|
| Source: U.S. Energy Information Administration | |||||
| Temperature -- Heating & Cooling Degree Days (week ending May 24) | ||||||||
|---|---|---|---|---|---|---|---|---|
HDD deviation from: |
CDD deviation from: |
|||||||
| Region | HDD Current |
normal |
last year |
CDD Current |
normal |
last year |
||
| New England | 28
|
-21
|
-7
|
3
|
1
|
0
|
||
| Middle Atlantic | 15
|
-23
|
-4
|
8
|
1
|
-1
|
||
| E N Central | 16
|
-28
|
-5
|
21
|
7
|
4
|
||
| W N Central | 15
|
-23
|
-12
|
32
|
14
|
16
|
||
| South Atlantic | 4
|
-10
|
-1
|
51
|
5
|
-15
|
||
| E S Central | 2
|
-12
|
-3
|
47
|
11
|
-11
|
||
| W S Central | 0
|
-2
|
0
|
80
|
15
|
-15
|
||
| Mountain | 34
|
-17
|
-32
|
40
|
15
|
28
|
||
| Pacific | 15
|
-18
|
-33
|
9
|
0
|
9
|
||
| United States | 14
|
-19
|
-11
|
32
|
6
|
0
|
||
|
Note: HDD = heating degree-day; CDD = cooling degree-day Source: National Oceanic and Atmospheric Administration | ||||||||
Average temperature (°F)
7-Day Mean ending May 24, 2012
Source: NOAA/National Weather Service
Deviation between average and normal (°F)
7-Day Mean ending May 24, 2012
Source: NOAA/National Weather Service
Monthly dry shale gas production
billion cubic feet per day
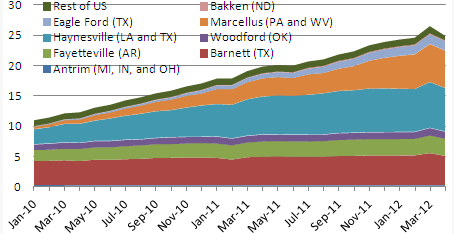
Source: Lippman Consulting, Inc. Gross withdrawal estimates are as of April 2012 and converted to dry production estimates with EIA-calculated average.