In the News:
Natural Gas Rig Count Briefly Drops Below 600.
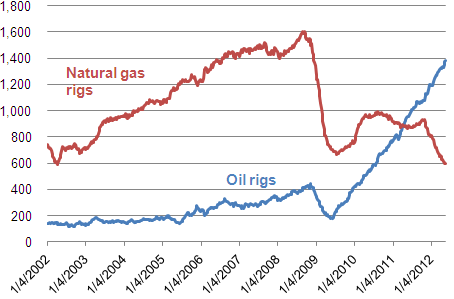
The natural gas rotary rig count, as reported by Baker Hughes Incorporated, rose by 2 this week to 600, after falling to a 10-year low of 598 last week. After increasing modestly to 936 active rigs in the fall of 2011, the natural gas rig count has dropped sharply. The oil rig count, currently at 1,382, has generally risen steadily since 2009, largely in response to increasing crude oil prices.
Natural gas rigs are currently down about 31 percent from their level at the same time last year, while oil rigs have risen by 45 percent over the same period. However, increased productivity from shale gas formations (generated by horizontal drilling and hydraulic fracturing) and rising associated production from expanding oil-directed development activity have helped maintain robust natural gas production.
Overview:
(For the Week Ending Wednesday, May 23, 2012)
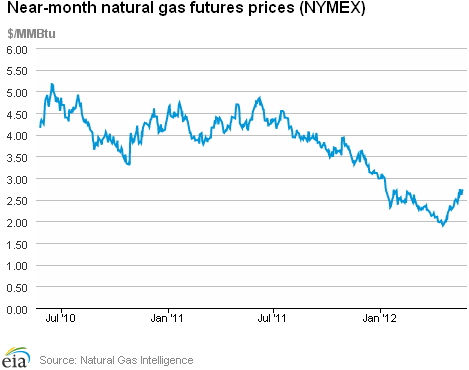
- Natural gas prices, led by the futures market, advanced modestly in nearly all markets over the week. At the New York Mercantile Exchange (NYMEX), the June 2012 natural gas contract ended the week up 11.9 cents per million British thermal units (MMBtu) to close at $2.737 per MMBtu on May 23.
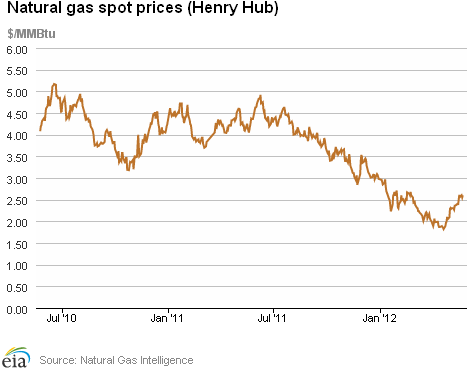
- The Henry Hub price followed the NYMEX lead, closing at $2.60 per MMBtu on May 23, up 10 cents per MMBtu for the week.
- Working natural gas in storage rose last week to 2,744 billion cubic feet (Bcf) as of Friday, May 18, according to EIA's Weekly Natural Gas Storage Report (WNGSR). An implied storage build of 77 Bcf for the week positioned storage volumes 750 Bcf above year-ago levels.
- The natural gas rotary rig count, as reported by Baker Hughes Incorporated on May 18, rebounded by 2 to 600 active units. Meanwhile, oil-directed rigs increased by 10 to 1,382 units.
Prices:
At the NYMEX, the June 2012 contract increased from $2.618 per MMBtu last Wednesday to $2.737 per MMBtu yesterday, an increase of 11.9 cents per MMBtu (4.5 percent) over the period. The June 2012 contract led the futures market upturn with a 4.5 percent rally on expectations that hotter weather (and greater consumption) was approaching and that weekly inventory builds seemed to be moderating compared to the five-year average. The 3-Month Strip (average of June-July-August contracts) followed suit with a 10.7 cent per MMBtu (4.0 percent) gain for the week.
Movement in the Henry Hub day-ahead price reflected a widespread increase in market prices in this week's cash market by rising 4.0 percent, from $2.50 per MMBtu the previous Wednesday to $2.60 per MMBtu yesterday. As the Spot Prices tab on the left shows, the Henry Hub cash price rose beginning last Thursday. During the same period, numerous other spot market pricing points exhibited similar gains and also held or increased slightly.
Nearly all downstream trading locations registered higher prices despite consumption dropping modestly this week. Spot prices at Transcontinental Pipeline's Zone 6 trading point for delivery into New York City, which started the week at $2.64 per MMBtu, gained $0.13 per MMBtu over the week (Wednesday to Wednesday) to close at $2.77 per MMBtu (up 4.9 percent). Over the same period, the Chicago citygate spot price registered a 5-cent per MMBtu price gain (from $2.57 per MMBtu last Wednesday), ending the week at $2.62 per MMBtu (up 1.9 percent).
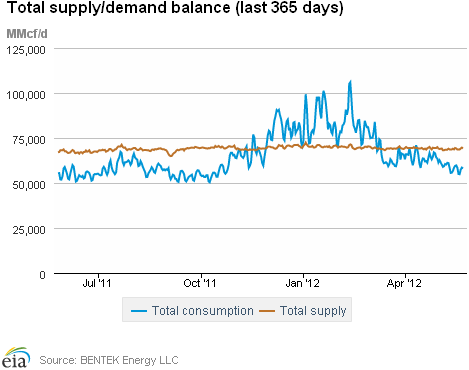
In the midst of seasonal temperatures throughout the more-populated regions over the past week, total consumption decreased slightly. According to estimates from BENTEK Energy LLC (Bentek), domestic natural gas consumption fell by 0.9 percent from last week. The residential/commercial sector led the decrease, posting a 9.1 percent decline, and the industrial sector registered a 0.8 percent decrease. The power sector, however, showed a partially offsetting 3.5 percent week-over-week gain attributed to increased power burn in Texas and key regions including the Northeast, Southeast, Midcontinent, and Rockies.
Total supply was up slightly for the week despite flat dry gas production. According to Bentek estimates, the week's average total natural gas supply posted a 0.2 percent increase from last week's level, led by a 2.0 percent increase in imports from Canada, which averaged 5.1 Bcf per day over the period. Imports from Canada stand 9.2 percent above year-ago volumes for the same week. There was also a 10.9 percent increase in supply of liquefied natural gas (LNG) during the week, with sendout averaging 370 MMcf per day; however, sendout volumes remain 67.8 percent below year-ago levels. Anchoring these supply gains was another week of essentially flat domestic dry gas production which averaged 63.6 Bcf per day, unchanged from the previous week and 3.6 percent above this time last year.
Storage
Working natural gas in storage increased to 2,744 Bcf as of Friday, May 18, according to EIA's WNGSR. This represents a net injection of 77 Bcf from the previous week. This week's injection was 20 Bcf lower than the 5-year (2007-2011) average injection for the same week. During the same week last year, the implied net injection was 101 Bcf. Working inventories are currently 750 Bcf (38 percent) greater than their year-ago levels and 753 Bcf (38 percent) greater than the 5-year average.
All three storage regions posted increases this week. Inventories in the East, West, and Producing Regions increased by 45 Bcf, 13 Bcf, and 19 Bcf, respectively. In the Producing Region, working natural gas inventories increased 19 Bcf in salt cavern facilities and remained at the previous week's level in nonsalt cavern facilities.
Temperatures in the lower 48 States during the week ending May 17 were 2.6 degrees warmer than the 30-year normal temperature and 4.9 degrees warmer than the same period last year. The average temperature in the lower 48 States was 64.3 degrees, 2.6 degrees higher than the 30-year normal of 61.7 degrees. While overall temperatures were a few degrees warmer than normal, temperatures varied somewhat across Census Divisions. The Mountain and Pacific Regions in the West were relatively warm, averaging 5.1 and 4.7 degrees, respectively, warmer than the 30-year normal. In the South, the West South Central Region was 1.7 degrees cooler than the 30-year normal, while the South Atlantic and East South Central Regions were 2.1 and 0.9 degrees, respectively, warmer than the 30-year normal.
See also:
Oil and Natural Gas Rigs, 2002 - 2012
number of rigs
Source: Baker Hughes Incorporated
| Spot Prices ($/MMBtu) | Thu, 17-May |
Fri, 18-May |
Mon, 21-May |
Tue, 22-May |
Wed, 23-May |
|---|---|---|---|---|---|
| Henry Hub | 2.61 |
2.56 |
2.60 |
2.55 |
2.60 |
| New York | 2.71 |
2.59 |
2.72 |
2.73 |
2.77 |
| Chicago | 2.59 |
2.53 |
2.61 |
2.59 |
2.62 |
| Cal. Comp. Avg,* | 2.68 |
2.62 |
2.67 |
2.64 |
2.66 |
| Futures ($/MMBtu) | |||||
| June Contract | 2.594 |
2.742 |
2.609 |
2.707 |
2.737 |
| July Contract | 2.673 |
2.822 |
2.689 |
2.776 |
2.796 |
| *Avg. of NGI's reported prices for: Malin, PG&E citygate, and Southern California Border Avg. | |||||
| Source: NGI's Daily Gas Price Index | |||||
| U.S. Natural Gas Supply - Gas Week: (5/16/12 - 5/23/12) | ||
|---|---|---|
Percent change for week compared with: |
||
last year |
last week |
|
| Gross Production | 3.63%
|
-0.04%
|
| Dry Production | 3.65%
|
-0.04%
|
| Canadian Imports | 9.22%
|
2.03%
|
| West (Net) | 11.84%
|
1.29%
|
| MidWest (Net) | 14.07%
|
-1.47%
|
| Northeast (Net) | -16.78%
|
27.12%
|
| LNG Imports | -67.80%
|
10.88%
|
| Total Supply | 2.81%
|
0.17%
|
| Source: BENTEK Energy LLC | ||
| U.S. Consumption - Gas Week: (5/16/12 - 5/23/12) | ||
|---|---|---|
Percent change for week compared with: |
||
last year |
last week |
|
| U.S. Consumption | 8.46%
|
-0.90%
|
| Power | 33.52%
|
3.54%
|
| Industrial | 0.31%
|
-0.45%
|
| Residential/Commercial | -13.43%
|
-9.14%
|
| Total Demand | 8.98%
|
-0.86%
|
| Source: BENTEK Energy LLC | ||
Weekly natural gas rig count and spot Henry Hub
active rigs$ per MMBtu
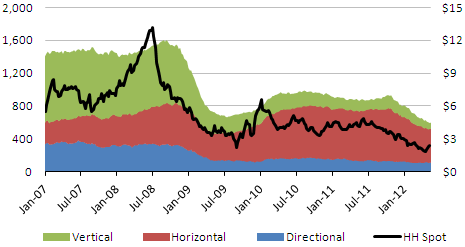
Source: Baker Hughes
| Rigs | |||
|---|---|---|---|
Fri, May 18, 2012 |
Change from |
||
last week |
last year |
||
| Oil Rigs | 1,382 |
0.73% |
44.86% |
| Natural Gas Rigs | 600 |
0.33% |
-30.72% |
| Miscellaneous | 4 |
0.00% |
-60.00% |
| Rig Numbers by Type | |||
|---|---|---|---|
Fri, May 18, 2012 |
Change from |
||
last week |
last year |
||
| Vertical | 566 |
1.25% |
-0.18% |
| Horizontal | 1,193 |
0.51% |
14.93% |
| Directional | 227 |
-0.44% |
0.89% |
| Source: Baker Hughes Inc. | |||
| Working Gas in Underground Storage | ||||
|---|---|---|---|---|
Stocks billion cubic feet (bcf) |
||||
| Region | 5/18/12
|
5/11/12
|
change |
|
| East | 1,281 |
1,236 |
45
|
|
| West | 399 |
386 |
13
|
|
| Producing | 1,064 |
1,045 |
19
|
|
| Total | 2,744 |
2,667 |
77
|
|
| Source: U.S. Energy Information Administration | ||||
| Working Gas in Underground Storage | |||||
|---|---|---|---|---|---|
Historical Comparisons |
|||||
Year ago (5/18/11) |
5-year average (2007-2011) |
||||
| Region | Stocks (Bcf) |
% change |
Stocks (Bcf) |
% change |
|
| East | 844 |
51.8 |
900 |
42.3 |
|
| West | 259 |
54.1 |
301 |
32.6 |
|
| Producing | 891 |
19.4 |
790 |
34.7 |
|
| Total | 1,994 |
37.6 |
1,991 |
37.8 |
|
| Source: U.S. Energy Information Administration | |||||
| Temperature -- Heating & Cooling Degree Days (week ending May 17) | ||||||||
|---|---|---|---|---|---|---|---|---|
HDD deviation from: |
CDD deviation from: |
|||||||
| Region | HDD Current |
normal |
last year |
CDD Current |
normal |
last year |
||
| New England | 34
|
-31
|
-46
|
0
|
-1
|
0
|
||
| Middle Atlantic | 26
|
-25
|
-13
|
4
|
0
|
4
|
||
| E N Central | 41
|
-16
|
-27
|
1
|
-9
|
-11
|
||
| W N Central | 32
|
-18
|
-49
|
9
|
-3
|
5
|
||
| South Atlantic | 12
|
-8
|
-4
|
44
|
7
|
5
|
||
| E S Central | 14
|
-5
|
-27
|
29
|
1
|
8
|
||
| W S Central | 5
|
1
|
-12
|
42
|
-11
|
6
|
||
| Mountain | 44
|
-19
|
-33
|
35
|
17
|
22
|
||
| Pacific | 8
|
-32
|
-62
|
8
|
1
|
8
|
||
| United States | 24
|
-18
|
-30
|
19
|
0
|
4
|
||
|
Note: HDD = heating degree-day; CDD = cooling degree-day Source: National Oceanic and Atmospheric Administration | ||||||||
Average temperature (°F)
7-Day Mean ending May 17, 2012
Source: NOAA/National Weather Service
Deviation between average and normal (°F)
7-Day Mean ending May 17, 2012
Source: NOAA/National Weather Service
Monthly dry shale gas production
billion cubic feet per day
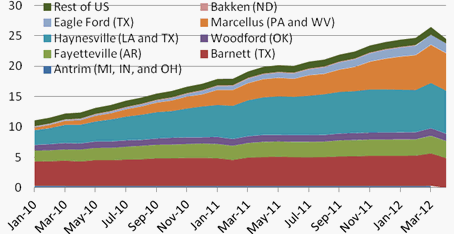
Source: Lippman Consulting, Inc. Gross withdrawal estimates are as of April 2012 and converted to dry production estimates with EIA-calculated average.