In the News:
Recent Warm Temperatures in the Pacific Northwest Might Affect Hydro Supply in the Summer.
Warmer-than-normal temperatures in the Pacific Northwest this week, as well as a warmer-than-normal forecast over the next two weeks, might shorten this year's peak hydropower season in the Pacific Northwest, according to recent analysis by BENTEK Energy LLC (Bentek). While the most recent forecast from the Northwest River Forecast Center for hydro levels are well above normal (although still less than last year's extremely strong hydro season), the warm temperatures might cause snowpack in the region to melt off more quickly than it otherwise would.
Hydropower makes up the majority of generation in the Pacific Northwest. Hydropower levels are typically stronger during the spring, when snowpack melts off. Last year, abundant supplies led the Bonneville Power Administration to issue curtailments on thermal and wind generation in order to use excess supplies of hydropower. (If excess water is not used, and instead runs off into dam spillways, it may damage ecosystems.)
Overview:
(For the Week Ending Wednesday, May 16, 2012)
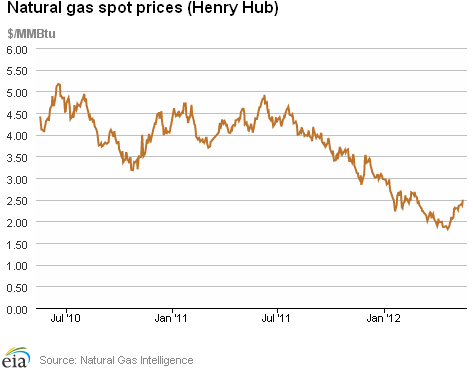
- Natural gas prices remained above $2.30 per million British thermal units (MMBtu) over the report week (Wednesday to Wednesday) at most of the country's trading locations. The Henry Hub price moved within a 5-cent range for much of the week before rising sharply, closing at $2.50 per MMBtu yesterday (up 14 cents for the week).
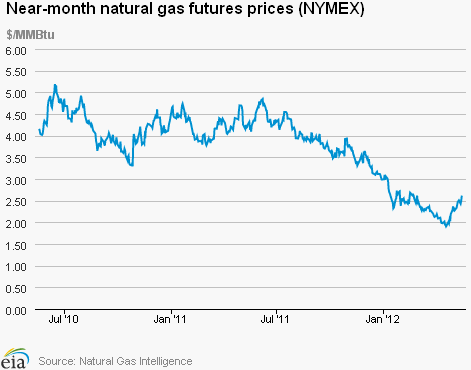
- The natural gas futures market trended higher over the week. At the New York Mercantile Exchange (NYMEX), the June 2012 natural gas contract gained 15.3 cents per MMBtu to close at $2.618 per MMBtu yesterday.
- Working natural gas in storage rose last week to 2,667 billion cubic feet (Bcf) as of Friday, May 11, according to the U.S. Energy Information Administration's (EIA) Weekly Natural Gas Storage Report (WNGSR). An implied storage build of 61 Bcf for the week positioned storage volumes 774 Bcf above year-ago levels.
- The natural gas rotary rig count, as reported by Baker Hughes Incorporated on May 11, fell by 8 to 598 active units, the first week since April 2002 that the count dipped below 600. Meanwhile, oil-directed rigs increased by 17 to 1,372 units.
Prices:
The Henry Hub day-ahead price generally rose during the week, dipping modestly on Tuesday before climbing sharply yesterday to close the week at $2.50 per MMBtu, up 5.9 percent. The fairly narrow trading range over most of the week reflected a relatively flat cash market, with the price fluctuating between $2.36 and $2.41 per MMBtu. Yesterday's price represents the first $2.50 or higher close since late February, and is 68 cents higher (37.4 percent) than the year's low of $1.82, recorded on April 20.
At the NYMEX, the June 2012 contract rose from $2.465 per MMBtu last Wednesday to $2.618 per MMBtu yesterday, an increase of 15.3 cents (6.2 percent). While relatively steady late last week, prices increased significantly over the past three days, rising 18.7 cents from Monday to yesterday's close. The 12-Month Strip (average of June 2012 to May 2013 contracts) closed yesterday at $3.167 per MMBtu, up 8.9 cents per MMBtu (2.9 percent) for the week.
Prices at many downstream trading locations generally rose, dropping on Friday before rebounding, typically closing much higher by the end of the week. For example, spot prices at the Algonquin Citygate trading point for delivery into Boston, which started the week at $2.59 per MMBtu, fell to $2.01 per MMBtu on Friday and then rose for the much of the remainder of the period to close yesterday at $2.78 per MMBtu (up 7.3 percent for the week). Similarly, prices at the Transcontinental Pipeline's Zone 6 trading point (which serves New York City markets) declined from $2.46 per MMBtu last Wednesday to $2.43 per MMBtu on Friday, then climbed to $2.64 per MMBtu by week's end (up 7.3 percent).
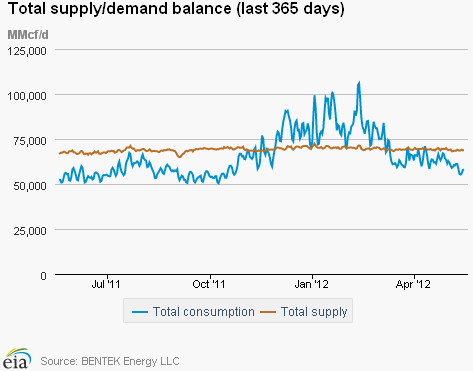
Total consumption for the report week registered an overall decline, as an increase in industrial sector demand was offset by decreases in other sectors. According to estimates from Bentek, domestic natural gas consumption fell by 5.1 percent from last week, driven by a decline of 10.9 percent in power sector consumption and a 1.9 percent decline in the residential/commercial sector. Industrial sector consumption ended the week up 1.2 percent, 0.7 percent above last year's consumption for the same week.
Total supply was essentially unchanged for the week, registering an overall increase of 0.3 percent, reflecting a small increase in dry gas production. According to Bentek estimates, domestic weekly dry gas production was 0.2 percent higher than the previous week (and 3.7 percent above the same time last year). Imports from Canada also rose only modestly, with an increase in shipments to the West being mostly offset by declines in the Midwest and Northeast. For the week, imports from Canada stand 1.5 percent above year-ago volumes. While liquefied natural gas (LNG) sendout rose sharply - up 36.0 percent from last week - sendout volumes remain 57.5 percent below year-ago levels.
Storage
Working natural gas in storage increased to 2,667 Bcf as of Friday, May 11, according to EIA's WNGSR. This represents a net injection of 61 Bcf from the previous week. This week's injection was 30 Bcf lower than the 5-year (2007-2011) average injection for the same week. During the same week last year, the implied net injection was 86 Bcf. Working inventories are currently 774 Bcf (41 percent) greater than their year-ago levels and 773 Bcf (41 percent) greater than the 5-year average.
All three storage regions posted increases this week. Inventories in the East, West, and Producing Regions increased by 47 Bcf, 7 Bcf, and 7 Bcf, respectively. In the Producing Region, working natural gas inventories decreased 3 Bcf in salt cavern facilities and increased 10 Bcf in nonsalt cavern facilities.
Temperatures in the lower 48 States during the week ending May 10 were 4.4 degrees warmer than the 30-year normal temperature and 2.6 degrees warmer than the same period last year. The average temperature in the lower 48 States was 64.1 degrees, 4.4 degrees higher than the 30-year normal of 59.7 degrees. During the week all regions were warmer than normal. The East South Central and South Atlantic Regions in the South were particularly warm, averaging 7.0 and 6.3 degrees, respectively, warmer than the 30-year normal.
See also:
Pacific Northwest Consumption of Natural Gas for Power Generation, 2011 and 2012
MMcf/day
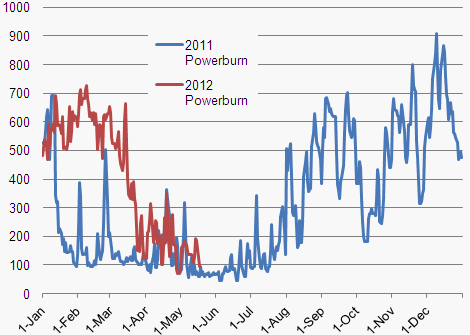
Source: Bentek Energy
| Spot Prices ($/MMBtu) | Thu, 10-May |
Fri, 11-May |
Mon, 14-May |
Tue, 15-May |
Wed, 16-May |
|---|---|---|---|---|---|
| Henry Hub | 2.36 |
2.37 |
2.41 |
2.38 |
2.50 |
| New York | 2.46 |
2.43 |
2.53 |
2.53 |
2.64 |
| Chicago | 2.38 |
2.37 |
2.43 |
2.44 |
2.57 |
| Cal. Comp. Avg,* | 2.49 |
2.50 |
2.56 |
2.53 |
2.63 |
| Futures ($/MMBtu) | |||||
| June Contract | 2.487 |
2.509 |
2.431 |
2.500 |
2.618 |
| July Contract | 2.569 |
2.589 |
2.505 |
2.568 |
2.687 |
| *Avg. of NGI's reported prices for: Malin, PG&E citygate, and Southern California Border Avg. | |||||
| Source: NGI's Daily Gas Price Index | |||||
| U.S. Natural Gas Supply - Gas Week: (5/9/12 - 5/16/12) | ||
|---|---|---|
Percent change for week compared with: |
||
last year |
last week |
|
| Gross Production | 3.67%
|
0.17%
|
| Dry Production | 3.68%
|
0.17%
|
| Canadian Imports | 1.49%
|
0.72%
|
| West (Net) | 10.35%
|
7.71%
|
| MidWest (Net) | 0.53%
|
-2.54%
|
| Northeast (Net) | -30.75%
|
-18.05%
|
| LNG Imports | -57.50%
|
35.96%
|
| Total Supply | 2.81%
|
0.34%
|
| Source: BENTEK Energy LLC | ||
| U.S. Consumption - Gas Week: (5/9/12 - 5/16/12) | ||
|---|---|---|
Percent change for week compared with: |
||
last year |
last week |
|
| U.S. Consumption | 6.16%
|
-5.05%
|
| Power | 26.82%
|
-10.92%
|
| Industrial | 0.67%
|
1.19%
|
| Residential/Commercial | -11.87%
|
-1.94%
|
| Total Demand | 6.22%
|
-4.74%
|
| Source: BENTEK Energy LLC | ||
Weekly natural gas rig count and spot Henry Hub
active rigs$ per MMBtu
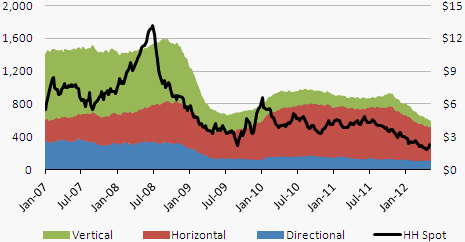
Source: Baker Hughes
| Rigs | |||
|---|---|---|---|
Fri, May 11, 2012 |
Change from |
||
last week |
last year |
||
| Oil Rigs | 1,372 |
1.25% |
44.88% |
| Natural Gas Rigs | 598 |
-1.32% |
-31.58% |
| Miscellaneous | 4 |
0.00% |
-55.56% |
| Rig Numbers by Type | |||
|---|---|---|---|
Fri, May 11, 2012 |
Change from |
||
last week |
last year |
||
| Vertical | 559 |
-2.44% |
-0.71% |
| Horizontal | 1,187 |
2.50% |
14.02% |
| Directional | 228 |
-2.56% |
0.88% |
| Source: Baker Hughes Inc. | |||
| Working Gas in Underground Storage | ||||
|---|---|---|---|---|
Stocks billion cubic feet (bcf) |
||||
| Region | 5/11/12
|
5/4/12
|
change |
|
| East | 1,236 |
1,189 |
47
|
|
| West | 386 |
379 |
7
|
|
| Producing | 1,045 |
1,038 |
7
|
|
| Total | 2,667 |
2,606 |
61
|
|
| Source: U.S. Energy Information Administration | ||||
| Working Gas in Underground Storage | |||||
|---|---|---|---|---|---|
Historical Comparisons |
|||||
Year ago (5/11/11) |
5-year average (2007-2011) |
||||
| Region | Stocks (Bcf) |
% change |
Stocks (Bcf) |
% change |
|
| East | 788 |
56.9 |
843 |
46.6 |
|
| West | 248 |
55.6 |
288 |
34.0 |
|
| Producing | 857 |
21.9 |
763 |
37.0 |
|
| Total | 1,893 |
40.9 |
1,894 |
40.8 |
|
| Source: U.S. Energy Information Administration | |||||
| Temperature -- Heating & Cooling Degree Days (week ending May 10) | ||||||||
|---|---|---|---|---|---|---|---|---|
HDD deviation from: |
CDD deviation from: |
|||||||
| Region | HDD Current |
normal |
last year |
CDD Current |
normal |
last year |
||
| New England | 67
|
-14
|
-6
|
0
|
0
|
0
|
||
| Middle Atlantic | 40
|
-26
|
-20
|
1
|
0
|
1
|
||
| E N Central | 40
|
-31
|
-14
|
7
|
2
|
-2
|
||
| W N Central | 39
|
-22
|
3
|
19
|
12
|
-6
|
||
| South Atlantic | 7
|
-20
|
-24
|
53
|
24
|
16
|
||
| E S Central | 7
|
-18
|
-20
|
51
|
31
|
17
|
||
| W S Central | 4
|
-3
|
-3
|
71
|
28
|
0
|
||
| Mountain | 58
|
-17
|
-8
|
17
|
3
|
3
|
||
| Pacific | 26
|
-20
|
-22
|
5
|
-1
|
2
|
||
| United States | 31
|
-21
|
-14
|
25
|
10
|
4
|
||
|
Note: HDD = heating degree-day; CDD = cooling degree-day Source: National Oceanic and Atmospheric Administration | ||||||||
Average temperature (°F)
7-Day Mean ending May 10, 2012
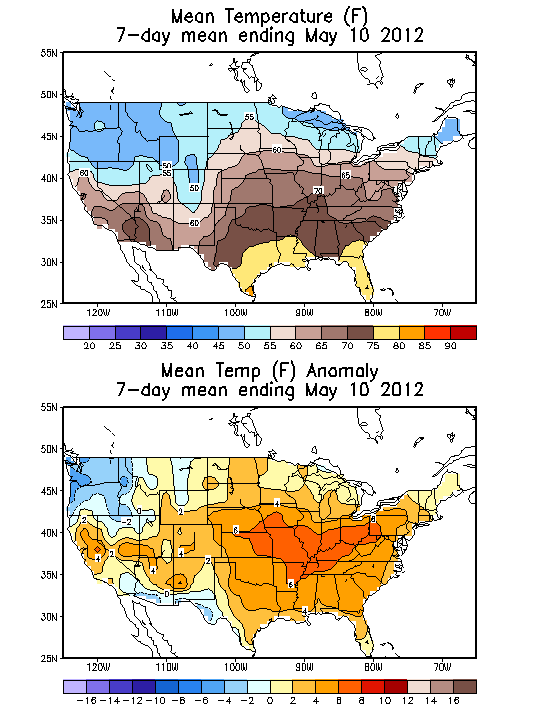
Source: NOAA/National Weather Service
Deviation between average and normal (°F)
7-Day Mean ending May 10, 2012
Source: NOAA/National Weather Service
Monthly dry shale gas production
billion cubic feet per day
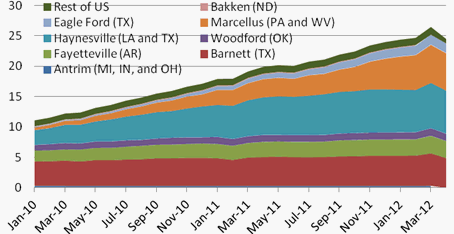
Source: Lippman Consulting, Inc. Gross withdrawal estimates are as of April 2012 and converted to dry production estimates with EIA-calculated average.