In the News:
Reported natural gas gross withdrawals for February decline.
Natural gas gross withdrawals, as reported by the U.S. Energy Information Administration's (EIA) 914 survey, declined by 0.6 percent in the lower 48 States in February, the most recent month for which data are available. Gross withdrawals in Louisiana fell by 4.8 percent, or about 420 million cubic feet (MMcf) per day. This is the third consecutive month of decline in Louisiana. Withdrawals in Wyoming also fell, by 3.5 percent, about 230 MMcf per day.
Gains in other areas of the lower 48 States offset most of the declines. Withdrawals in the category for "other states", which includes the states in the Marcellus Shale, grew by 260 MMcf per day, or 1.2 percent. EIA also noted that new wells in Colorado contributed to the increase in the "other states" category.
Overview:
(For the Week Ending Wednesday, May 2, 2012)
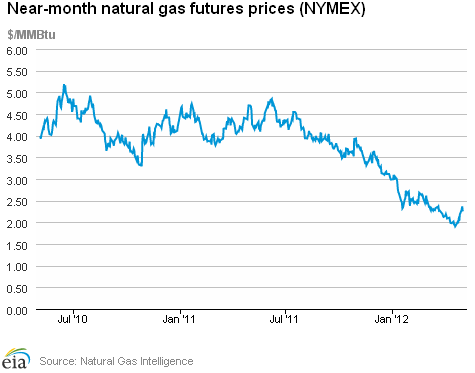
- The natural gas futures market led a 3-day rally with natural gas prices showing an increase for the week. At the New York Mercantile Exchange (NYMEX), the June 2012 natural gas contract ended the week up 8.3 cents per million British thermal units (MMBtu) to close at $2.253 per MMBtu on
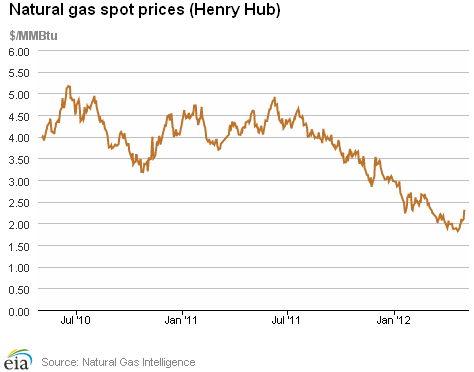
May 2. - The Henry Hub price followed the NYMEX lead, closing at $2.31 per MMBtu on May 2, up 32 cents per MMBtu for the week.
- Working natural gas in storage rose slightly last week to 2,576 billion cubic feet (Bcf) as of Friday, April 27, according to EIA's Weekly Natural Gas Storage Report (WNGSR). An implied storage build of 28 Bcf for the week positioned storage volumes 840 Bcf above year-ago levels.
- The natural gas rotary rig count, as reported by Baker Hughes Incorporated on April 27, decreased by 18 to 613 active units. Meanwhile, oil-directed rigs decreased by 9 to 1,328 units.
Prices:
At the NYMEX, the June 2012 contract rose from $2.170 per MMBtu last Wednesday to $2.253 per MMBtu yesterday, an increase of 8.3 cents per MMBtu (3.8 percent) over the period. The June 2012 contract led the upturn in the futures market with an 11.5 percent rally over three days before giving back 5.0 percent yesterday on forecasts of more moderate weather. The 3-Month Strip (average of June-July-August contracts) followed suit with a 16.9 cent per MMBtu gain for the week.
Movement in the Henry Hub day-ahead price reflected a widespread increase in market prices in this week's cash market by rising 16.1 percent, from $1.99 per MMBtu the previous Wednesday to $2.31 per MMBtu yesterday. As the Spot Prices tab on the left shows, the Henry Hub cash price began a rebound on Monday, moving well above the $2.00 per MMBtu threshold. During the same period, numerous other spot market pricing points also added double-digit gains.
Nearly all downstream trading locations registered higher prices as consumption increased modestly this week. Spot prices at Transcontinental Pipeline's Zone 6 trading point for delivery into New York City, which started the week at $2.18 per MMBtu, gained $0.40 per MMBtu over the week (Wednesday to Wednesday) to close at $2.58 per MMBtu (up 18.3 percent). Over the same period, the Chicago citygate spot price registered a 21-cent per MMBtu price gain (from $2.11 per MMBtu last Wednesday), ending the week at $2.32 per MMBtu (up 10.0 percent).
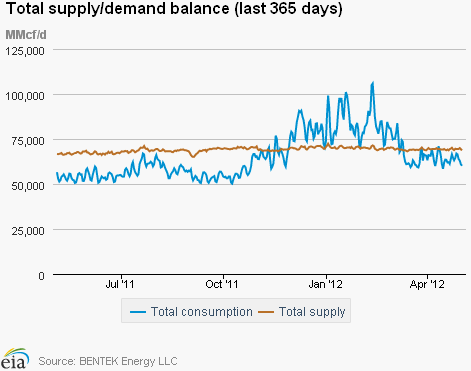
In the midst of seasonal temperatures throughout the more-populated regions over the past week, total consumption increased slightly. According to estimates from BENTEK Energy LLC (Bentek), domestic natural gas consumption rose by 0.6 percent from last week. The power sector led the increase, posting a 6.1 percent gain in natural gas used for power burn. However, the residential/commercial sector showed a 4.8 percent week-over-week loss, while the industrial sector registered a 0.8 percent decrease.
Total supply was up slightly for the week despite a small decrease in dry gas production. According to Bentek estimates, the week's average total natural gas supply posted a 0.1 percent increase from last week's level, led by a 3.8 percent increase in imports from Canada, which averaged 5.3 Bcf per day over the period. Imports from Canada stand 0.8 percent below year-ago volumes for the same week. Offsetting these gains were a decrease in domestic weekly dry gas production, which averaged 63.9 Bcf per day, 0.1 percent less than the previous week and 5.2 percent above this time last year. There was also a 5.5 percent decrease in supply of liquefied natural gas (LNG) during the week, with sendout averaging 282 MMcf per day; sendout volumes remain 79.2 percent below year-ago levels.
Storage
Working natural gas in storage increased to 2,576 Bcf as of Friday, April 27, according to EIA's WNGSR. This represents a net injection of 28 Bcf from the previous week. This week's injection was 51 Bcf lower than the 5-year (2007-2011) average injection for the same week. During the same week last year, the implied net injection was 60 Bcf, likely due to warmer temperatures. Working inventories are currently 840 Bcf (48 percent) greater than their year-ago levels and 857 Bcf (50 percent) greater than the 5-year average.
Two of the three storage regions posted increases this week. Inventories in the East and West Regions increased by 20 Bcf and 9 Bcf, respectively, while in the Producing Region inventories decreased slightly by 1 Bcf. In the Producing Region, working natural gas inventories decreased 5 Bcf in salt cavern facilities and increased 4 Bcf in nonsalt cavern facilities.
Temperatures in the lower 48 States during the week ending April 26 were 1.1 degrees warmer than the 30-year normal temperature and 1.7 degrees cooler than the same period last year. The average temperature in the lower 48 States was 56.6 degrees, 1.2 degrees higher than the 30-year normal of 55.4. While overall temperatures were about a degree warmer than normal, temperatures varied somewhat by Census Division. The Mountain and the Pacific Regions in the West were particularly warm, averaging 12.0 and 5.9 degrees warmer, respectively, than the 30-year normal. In the South, the South Atlantic and East South Central Regions were particularly cool, averaging 3.1 and 2.4 degrees cooler, respectively, than the 30-year normal, while the West South Central was modestly (0.3 degrees) warmer than normal.
See also:
State Natural Gas Gross Withdrawals, 2009 - 2012
billion cubic feet per day
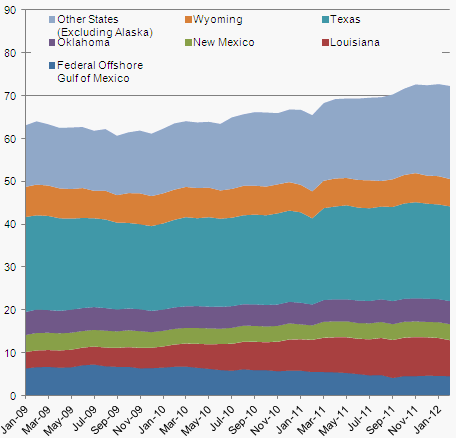
Source: Energy Information Administration, Monthly Natural Gas Gross Production Report
| Spot Prices ($/MMBtu) | Thu, 26-Apr |
Fri, 27-Apr |
Mon, 30-Apr |
Tue, 01-May |
Wed, 02-May |
|---|---|---|---|---|---|
| Henry Hub | 2.10 |
2.05 |
2.09 |
2.29 |
2.31 |
| New York | 2.29 |
2.26 |
2.35 |
2.54 |
2.58 |
| Chicago | 2.20 |
2.14 |
2.13 |
2.32 |
2.32 |
| Cal. Comp. Avg,* | 2.20 |
2.11 |
2.20 |
2.34 |
2.32 |
| Futures ($/MMBtu) | |||||
| May Contract | 2.036 |
expired |
expired |
expired |
expired |
| June Contract | 2.126 |
2.186 |
2.285 |
2.371 |
2.253 |
| July Contract | 2.242 |
2.299 |
2.394 |
2.468 |
2.354 |
| *Avg. of NGI's reported prices for: Malin, PG&E citygate, and Southern California Border Avg. | |||||
| Source: NGI's Daily Gas Price Index | |||||
| U.S. Natural Gas Supply - Gas Week: (4/25/12 - 5/2/12) | ||
|---|---|---|
Percent change for week compared with: |
||
last year |
last week |
|
| Gross Production | 5.17%
|
-0.14%
|
| Dry Production | 5.19%
|
-0.14%
|
| Canadian Imports | -0.83%
|
3.81%
|
| West (Net) | 4.68%
|
2.37%
|
| MidWest (Net) | -1.89%
|
1.89%
|
| Northeast (Net) | -15.77%
|
20.24%
|
| LNG Imports | -79.20%
|
-5.50%
|
| Total Supply | 3.02%
|
0.13%
|
| Source: BENTEK Energy LLC | ||
| U.S. Consumption - Gas Week: (4/25/12 - 5/2/12) | ||
|---|---|---|
Percent change for week compared with: |
||
last year |
last week |
|
| U.S. Consumption | 16.21%
|
0.59%
|
| Power | 41.30%
|
6.08%
|
| Industrial | 1.88%
|
-0.78%
|
| Residential/Commercial | 5.66%
|
-4.80%
|
| Total Demand | 15.47%
|
0.57%
|
| Source: BENTEK Energy LLC | ||
Weekly natural gas rig count and spot Henry Hub
active rigs$ per MMBtu
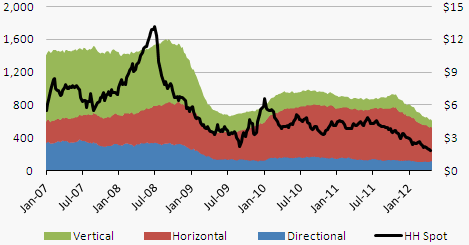
Source: Baker Hughes
| Rigs | |||
|---|---|---|---|
Fri, April 27, 2012 |
Change from |
||
last week |
last year |
||
| Oil Rigs | 1,328 |
-0.67% |
43.41% |
| Natural Gas Rigs | 613 |
-2.85% |
-30.50% |
| Miscellaneous | 4 |
0.00% |
-60.00% |
| Rig Numbers by Type | |||
|---|---|---|---|
Fri, April 27, 2012 |
Change from |
||
last week |
last year |
||
| Vertical | 563 |
-1.40% |
-2.26% |
| Horizontal | 1,139 |
-1.39% |
11.34% |
| Directional | 243 |
-1.22% |
10.96% |
| Source: Baker Hughes Inc. | |||
| Working Gas in Underground Storage | ||||
|---|---|---|---|---|
Stocks billion cubic feet (bcf) |
||||
| Region | 4/27/12
|
4/20/12
|
change |
|
| East | 1,165 |
1,145 |
20
|
|
| West | 371 |
362 |
9
|
|
| Producing | 1,040 |
1,041 |
-1
|
|
| Total | 2,576 |
2,548 |
28
|
|
| Source: U.S. Energy Information Administration | ||||
| Working Gas in Underground Storage | |||||
|---|---|---|---|---|---|
Historical Comparisons |
|||||
Year ago (4/27/11) |
5-year average (2007-2011) |
||||
| Region | Stocks (Bcf) |
% change |
Stocks (Bcf) |
% change |
|
| East | 695 |
67.6 |
740 |
57.4 |
|
| West | 231 |
60.6 |
264 |
40.5 |
|
| Producing | 810 |
28.4 |
715 |
45.5 |
|
| Total | 1,736 |
48.4 |
1,719 |
49.9 |
|
| Source: U.S. Energy Information Administration | |||||
| Temperature -- Heating & Cooling Degree Days (week ending Apr 26) | ||||||||
|---|---|---|---|---|---|---|---|---|
HDD deviation from: |
CDD deviation from: |
|||||||
| Region | HDD Current |
normal |
last year |
CDD Current |
normal |
last year |
||
| New England | 84
|
-30
|
-4
|
0
|
0
|
0
|
||
| Middle Atlantic | 100
|
3
|
33
|
0
|
0
|
-6
|
||
| E N Central | 113
|
12
|
23
|
0
|
0
|
-1
|
||
| W N Central | 84
|
-7
|
-36
|
4
|
2
|
4
|
||
| South Atlantic | 59
|
15
|
42
|
13
|
-7
|
-38
|
||
| E S Central | 55
|
15
|
45
|
4
|
-2
|
-28
|
||
| W S Central | 20
|
4
|
11
|
33
|
6
|
-36
|
||
| Mountain | 34
|
-65
|
-76
|
29
|
19
|
19
|
||
| Pacific | 22
|
-36
|
-43
|
9
|
5
|
9
|
||
| United States | 69
|
-7
|
1
|
10
|
1
|
-11
|
||
|
Note: HDD = heating degree-day; CDD = cooling degree-day Source: National Oceanic and Atmospheric Administration | ||||||||
Average temperature (°F)
7-Day Mean ending Apr 26, 2012
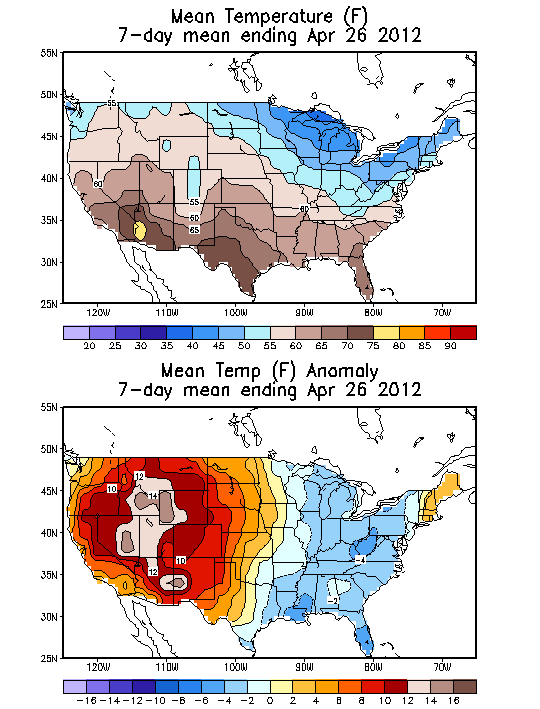
Source: NOAA/National Weather Service
Deviation between average and normal (°F)
7-Day Mean ending Apr 26, 2012
Source: NOAA/National Weather Service
Monthly dry shale gas production
billion cubic feet per day
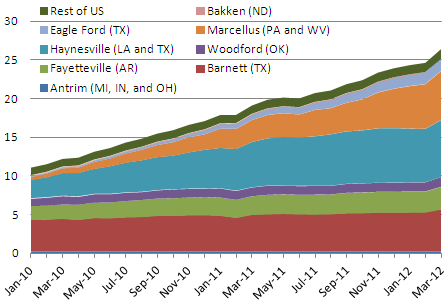
Source: Lippman Consulting, Inc. Gross withdrawal estimates are as of March 2012 and converted to dry production estimates with EIA-calculated average.