In the News:
NYMEX Prices for the Coming 12 Months Remain Low.
Prices for natural gas for contract months between May 2012 and April 2013 have fallen significantly over the past year. At the end of April 2011, prices for May 2012 (now the near-month contract) were trading close to $5.00 per million British thermal units (MMBtu), but are currently near $2.00 per MMBtu. In the last month, the 12-month futures prices have fallen about 30 cents across the board. While prices have risen in the past few days, they still are well below their levels of one month ago.
The continued low prices are the result of a relatively warm winter and abundant production and storage. While the near-month contract recently rose above $2.00 per MMBtu, earlier this month, near-month contract prices hit 10-year lows. The increase in prices for contract months beginning in the fall of 2013 reflects anticipated higher demand for the winter heating season.
Overview:
(For the Week Ending Wednesday, April 25, 2012)
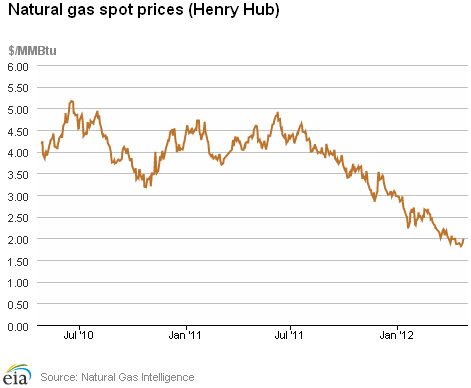
- With temperatures generally colder than last week yet still warmer-than-normal for this reporting period, natural gas prices remained under $2.00 per MMBtu for most of the week. The Henry Hub price climbed during the week's second half, closing at $1.99 per MMBtu yesterday (up 12 cents for the week).
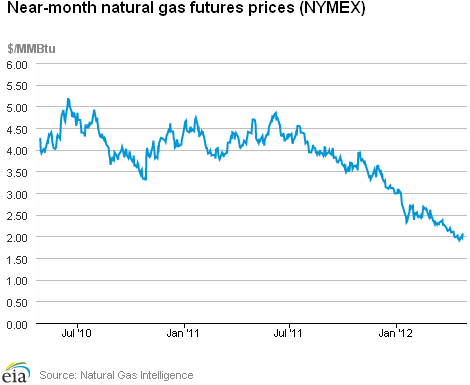
- At the New York Mercantile Exchange (NYMEX), the May 2012 natural gas contract rose 11.7 cents per MMBtu for the week, closing at $2.068 per MMBtu yesterday.
- Working natural gas in storage rose last week to 2,548 billion cubic feet (Bcf) as of Friday, April 20, according to the U.S. Energy Information Administration's (EIA) Weekly Natural Gas Storage Report (WNGSR). This represents a net injection of 47 Bcf from the previous week and positioned storage volumes 872 Bcf above year-ago levels.
- The natural gas rotary rig count, as reported April 20 by Baker Hughes Incorporated, rose by 7 to 631 active units after 2 consecutive weeks of decline. Meanwhile, oil-directed rigs increased by 15 to 1,337 units.
Prices:
The Henry Hub day-ahead price remained below $2.00 per MMBtu for the entire week, dropping to $1.82 per MMBtu on Friday before rising steadily to close the week yesterday at $1.99 per MMBtu. Prices at Henry Hub settled in a 17-cent range, from Friday's low to yesterday's high. While many spot market pricing points across the Northeast and Midwest also dipped below $2.00 per MMBtu over the course of the week, most closed the week above that mark.
At the NYMEX, the May 2012 contract rose from $1.951 per MMBtu last Wednesday to $2.068 per MMBtu yesterday, an increase of 11.7 cents (6.0 percent). Prices over the course of the week exhibited some movement, dipping to a low of $1.907 on Thursday. The contract stayed under the $2.000 per MMBtu threshold for four of six days, but finished yesterday nearly 7 cents over that mark. The 12-Month Strip (average of May 2012 to April 2013 contracts) closed yesterday at $2.695 per MMBtu, up 8.3 cents per MMBtu (3.2 percent) for the week.
Prices at many downstream trading locations generally followed the Henry Hub pattern, dropping on Thursday and Friday before rebounding, typically closing higher by the reporting week's end. For example, spot prices at the Algonquin Citygate trading point for delivery into Boston, which started the week at $2.11 per MMBtu, fell to $2.01 per MMBtu on Friday and then rose for the much of the remainder of the period to close yesterday at $2.26 per MMBtu (up 7.1 percent for the week). Similarly, prices at the Transcontinental Pipeline's Zone 6 trading point (which serves New York City markets) declined from $2.02 per MMBtu last Wednesday to $1.96 per MMBtu on Friday, then climbed to $2.18 per MMBtu by week's end (up 7.9 percent).
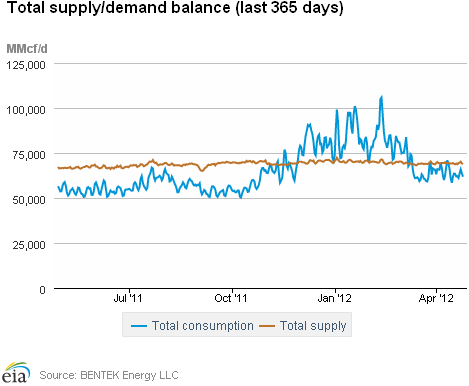
Total consumption for the report week registered an overall decrease, with a drop in power sector demand offsetting modest gains in other sectors. According to estimates from BENTEK Energy LLC (Bentek), domestic natural gas consumption fell by 1.1 percent from last week, driven by a 5.0 percent decline in consumption from the power generation sector. Consumption increased in both the residential/commercial and industrial sectors, which ended the week up 1.6 percent and 1.4 percent, respectively.
Total supply was essentially unchanged for the week, registering an overall increase of 0.3 percent, reflecting a small increase in dry gas production. According to Bentek estimates, domestic weekly dry gas production was 0.2 percent higher than the previous week (and 4.1 percent above the same time last year). Imports from Canada, too, rose only modestly, with increases in shipments to the West and Northeast being mostly offset by a decline in the Midwest. For the week, imports from Canada stand 8.4 percent below year-ago volumes. Liquefied natural gas (LNG) sendout during the week rose 14.3 percent, however sendout volumes remain 56.8 percent below year-ago levels.
Storage
Working natural gas in storage increased to 2,548 Bcf as of Friday, April 20, according to EIA's WNGSR. This represents a net injection of 47 Bcf from the previous week. This week's injection matched the 5-year (2007-2011) average injection for the same week. Last year the implied net injection was 35 Bcf, likely because of warmer temperatures during the same week last year. Working inventories are currently 872 Bcf (52%) greater than their year-ago levels and 908 Bcf (55%) greater than the 5-year average.
All three storage regions posted increases this week. Inventories in the East Region increased by 42 Bcf; inventories in the West, by 4 Bcf; and inventories in the Producing Region, by 1 Bcf. In the Producing Region, working natural gas inventories decreased 5 Bcf in salt cavern facilities and increased 5 Bcf in the nonsalt cavern facilities.
Temperatures in the lower 48 States during the week ending April 19 were 4.1 degrees warmer than the 30-year normal temperature and 3.7 degrees warmer than the same period last year. The average temperature in the lower 48 States was 57.6 degrees, 4.2 degrees higher than the 30-year normal of 53.4. During the week all regions with the exception of the West were warmer than normal. The New England and the Middle Atlantic Regions in the Northeast were particularly warm, averaging 11.0 and 8.9 degrees warmer than normal, respectively. In the West, the average temperature in the Pacific Region was cool, averaging 1.1 degrees cooler than normal, while in the Mountain Region the average temperature was normal.
See also:
May 2012 - April 2013, NYMEX Contract Prices
dollars per MMBTu
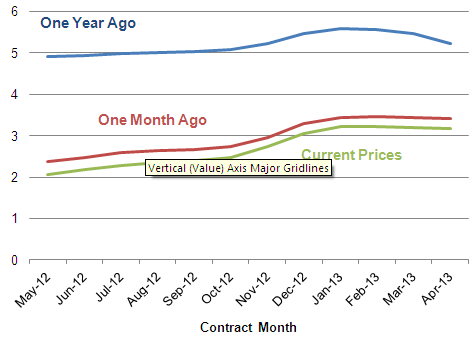
Source: Intelligence Press
| Spot Prices ($/MMBtu) | Thu, 19-Apr |
Fri, 20-Apr |
Mon, 23-Apr |
Tue, 24-Apr |
Wed, 25-Apr |
|---|---|---|---|---|---|
| Henry Hub | 1.85 |
1.82 |
1.89 |
1.97 |
1.99 |
| New York | 2.00 |
1.96 |
2.07 |
2.17 |
2.18 |
| Chicago | 2.00 |
1.98 |
2.01 |
2.09 |
2.11 |
| Cal. Comp. Avg,* | 2.14 |
2.06 |
2.13 |
2.22 |
2.17 |
| Futures ($/MMBtu) | |||||
| May Contract | 1.907 |
1.927 |
2.007 |
1.975 |
2.068 |
| June Contract | 1.995 |
2.015 |
2.096 |
2.063 |
2.170 |
| *Avg. of NGI's reported prices for: Malin, PG&E citygate, and Southern California Border Avg. | |||||
| Source: NGI's Daily Gas Price Index | |||||
| U.S. Natural Gas Supply - Gas Week: (4/18/12 - 4/25/12) | ||
|---|---|---|
Percent change for week compared with: |
||
last year |
last week |
|
| Gross Production | 4.04%
|
0.20%
|
| Dry Production | 4.05%
|
0.20%
|
| Canadian Imports | -8.38%
|
0.35%
|
| West (Net) | 0.81%
|
4.95%
|
| MidWest (Net) | -4.48%
|
-4.71%
|
| Northeast (Net) | -45.25%
|
4.08%
|
| LNG Imports | -56.76%
|
14.32%
|
| Total Supply | 2.40%
|
0.27%
|
| Source: BENTEK Energy LLC | ||
| U.S. Consumption - Gas Week: (4/18/12 - 4/25/12) | ||
|---|---|---|
Percent change for week compared with: |
||
last year |
last week |
|
| U.S. Consumption | 7.64%
|
-1.10%
|
| Power | 25.11%
|
-5.02%
|
| Industrial | 2.32%
|
1.40%
|
| Residential/Commercial | -3.61%
|
1.56%
|
| Total Demand | 7.58%
|
-0.61%
|
| Source: BENTEK Energy LLC | ||
Weekly natural gas rig count and spot Henry Hub
active rigs$ per MMBtu
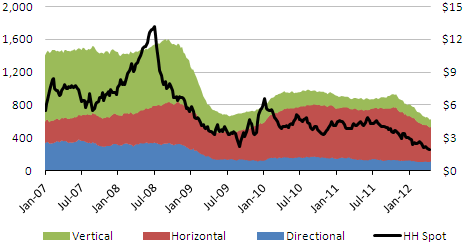
Source: Baker Hughes
| Rigs | |||
|---|---|---|---|
Fri, April 20, 2012 |
Change from |
||
last week |
last year |
||
| Oil Rigs | 1,337 |
1.13% |
46.44% |
| Natural Gas Rigs | 631 |
1.12% |
-28.13% |
| Miscellaneous | 4 |
0.00% |
-55.56% |
| Rig Numbers by Type | |||
|---|---|---|---|
Fri, April 20, 2012 |
Change from |
||
last week |
last year |
||
| Vertical | 571 |
0.53% |
0.71% |
| Horizontal | 1,155 |
0.87% |
13.24% |
| Directional | 246 |
3.80% |
15.49% |
| Source: Baker Hughes Inc. | |||
| Working Gas in Underground Storage | ||||
|---|---|---|---|---|
Stocks billion cubic feet (bcf) |
||||
| Region | 4/20/12
|
4/13/12
|
change |
|
| East | 1,145 |
1,103 R |
42
|
|
| West | 362 |
358 |
4
|
|
| Producing | 1,041 |
1,040 R |
1
|
|
| Total | 2,548 |
2,501 R |
47
|
|
| Source: U.S. Energy Information Administration, R = Revised | ||||
| Working Gas in Underground Storage | |||||
|---|---|---|---|---|---|
Historical Comparisons |
|||||
Year ago (4/20/11) |
5-year average (2007-2011) |
||||
| Region | Stocks (Bcf) |
% change |
Stocks (Bcf) |
% change |
|
| East | 662 |
73.0 |
695 |
64.7 |
|
| West | 225 |
60.9 |
255 |
42.0 |
|
| Producing | 789 |
31.9 |
691 |
50.7 |
|
| Total | 1,676 |
52.0 |
1,640 |
55.4 |
|
| Source: U.S. Energy Information Administration | |||||
| Temperature -- Heating & Cooling Degree Days (week ending Apr 19) | ||||||||
|---|---|---|---|---|---|---|---|---|
HDD deviation from: |
CDD deviation from: |
|||||||
| Region | HDD Current |
normal |
last year |
CDD Current |
normal |
last year |
||
| New England | 59
|
-73
|
-69
|
4
|
4
|
4
|
||
| Middle Atlantic | 57
|
-57
|
-48
|
5
|
5
|
5
|
||
| E N Central | 76
|
-42
|
-63
|
1
|
1
|
1
|
||
| W N Central | 82
|
-26
|
-60
|
0
|
-1
|
0
|
||
| South Atlantic | 35
|
-21
|
-2
|
24
|
9
|
-2
|
||
| E S Central | 32
|
-18
|
-9
|
8
|
3
|
-1
|
||
| W S Central | 13
|
-10
|
-3
|
36
|
15
|
-9
|
||
| Mountain | 108
|
-3
|
7
|
5
|
-3
|
-5
|
||
| Pacific | 70
|
5
|
18
|
0
|
-3
|
0
|
||
| United States | 62
|
-26
|
-27
|
10
|
3
|
-1
|
||
|
Note: HDD = heating degree-day; CDD = cooling degree-day Source: National Oceanic and Atmospheric Administration | ||||||||
Average temperature (°F)
7-Day Mean ending Apr 19, 2012
Source: NOAA/National Weather Service
Deviation between average and normal (°F)
7-Day Mean ending Apr 19, 2012
Source: NOAA/National Weather Service
Monthly dry shale gas production
billion cubic feet per day
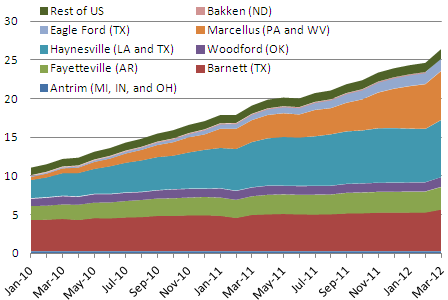
Source: Lippman Consulting, Inc. Gross withdrawal estimates are as of March 2012 and converted to dry production estimates with EIA-calculated average.