In the News:
California Faces Multiple Supply Constraints
The combination of increased natural gas demand in Southern California, due to maintenance on two nuclear generators, and pipeline constraints into the region has contributed to an increase in the basis, or the differential between regional prices and the benchmark Henry Hub price. The Southern California representative price is now about at parity with the Northern California PG&E Citygate pricing point, which is usually several cents above the Southern California price. Additionally, as the Henry Hub has continued a downward trend over the past couple of weeks, California prices have declined less and widened the basis. Among major infrastructure issues:
- Two nuclear units (totaling more than 2,000 MW) at the San Onofre Nuclear Generating Station, located south of San Clemente, are currently offline and are expected to remain out of service until at least the end of July, a few months longer than was originally planned. BENTEK Energy LLC (Bentek) estimates that the outage of the nuclear generators could mean additional demand of about 0.5 billion cubic feet (Bcf) per day of natural gas for power burn during the peak summer months if there are further delays.
- Southern California Gas is conducting maintenance on its system through May 4 and restricting all receipts on its North Needles point, which had averaged close to 490 million cubic feet (MMcf) per day before the outage, according to Bentek reports.
- Kern River cut secondary gas capacity for a few days this week at a compressor station in Southern Nevada, close to where the pipeline enters Southern California.
Overview:
(For the Week Ending Wednesday, April 18, 2012)
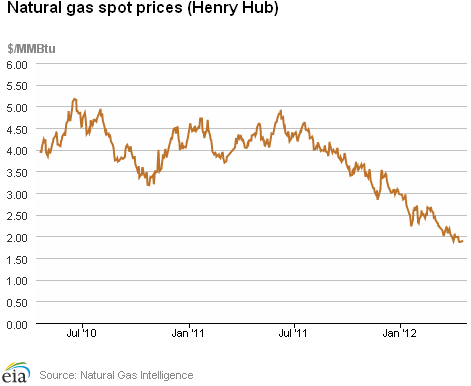
- With continued warmer-than-normal April temperatures, natural gas prices hovered just under the $2 mark for most of the week. The Henry Hub price closed at $1.87 per million British thermal units (MMBtu) yesterday, down 4 cents for the week.
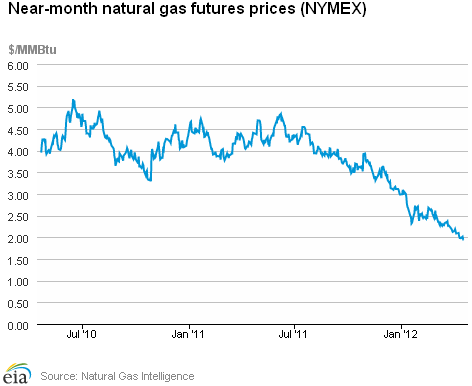
- At the New York Mercantile Exchange (NYMEX), the May 2012 natural gas contract fell 3.3 cents per MMBtu for the week, closing at $1.951 per MMBtu yesterday.
- Working natural gas in storage rose last week to 2,512 Bcf as of Friday, April 13, according to the U.S. Energy Information Administration's (EIA) Weekly Natural Gas Storage Report (WNGSR). This represents a net injection of 25 Bcf from the previous week and positioned storage volumes 871 Bcf above year-ago levels.
- The natural gas rotary rig count, as reported by Baker Hughes Incorporated on April 13, fell by 23 to 624 active units. Oil-directed rigs declined by 7 to 1,322 units. While gas-directed rigs are 29 percent lower than this time last year, oil-directed rigs are 50 percent higher than a year ago.
Prices:
The Henry Hub day-ahead price remained below $2.00 per MMBtu throughout the week and traded in a narrow 4 cent range with a high of $1.91 per MMBtu last Wednesday, a dip to $1.87 per MMBtu on Thursday and Friday, and after advancing slightly Monday and Tuesday closed the week at a low of $1.87 per MMBtu yesterday. Numerous other spot market pricing points across the country also remained below the $2.00 per MMBtu mark throughout the week.
At the NYMEX, the May 2012 contract fell slightly, from $1.984 per MMBtu last Wednesday to $1.951 per MMBtu yesterday, a decrease of 3.3 cents (1.7 percent). With the exception of Monday, when it reached $2.016 per MMBtu, the contract remained under the $2.00 per MMBtu level throughout the week. The 12-Month Strip (average of May 2012 to April 2013 contracts) remained above $2.60 per MMBtu throughout the week, closing yesterday at a low of $2.612 per MMBtu, down for the week 8.6 cents per MMBtu (3.2 percent) from last Wednesday's high of $2.698 per MMBtu.
Prices at nearly all downstream trading locations continued on a downward trend through the end of last week and began to firm up on Monday, led by Northeast trading points. Spot prices at the Algonquin Citygate trading point for delivery into Boston, which started the week at $2.74 per MMBtu, dropped to $2.09 per MMBtu on Friday and then increased for the remainder of the week to close at $2.11 per MMBtu yesterday (down 23.0 percent over the week). Over the same period, the Chicago citygate price fell from $2.02 per MMBtu last Wednesday to $1.94 per MMBtu on Friday before rebounding and ending the week at $2.00 per MMBtu (down a scant 1.0 percent for the week).
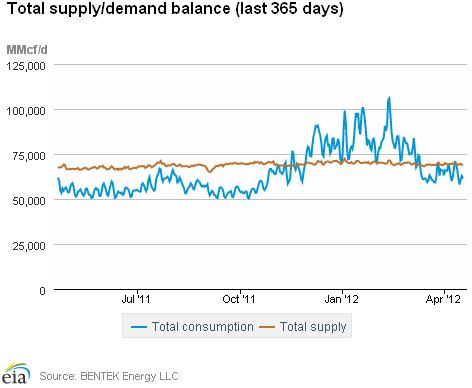
Total consumption over the report week (Wednesday to Wednesday) decreased in all sectors except power generation. According to estimates from Bentek, domestic natural gas consumption fell by 4.5 percent from last week. The residential/commercial sector led the decline with a 17.4 percent loss, while the industrial sector posted a 3.0 percent loss. In contrast, the power generation sector registered a 7.8 percent increase over the report week, with double-digit percentage increases in the Northeast, Midwest, and Southeast. These increases were in part offset by double-digit power burn declines in the Southwest and Pacific Northwest.
Total supply was down slightly for the week due to a small decline in dry gas production. According to Bentek estimates, the week's average total natural gas supply registered a 0.5 percent decrease from last week's level, led by a decline in dry gas production. Domestic weekly dry gas production was 0.6 percent lower than the previous week, yet 5.7 percent above the same time last year. The decrease in this week's dry gas production was accompanied by a 1.2 percent increase in imports from Canada, which stand 6.7 percent below year-ago volumes for the same week. There was an 11.0 percent decrease in liquefied natural gas (LNG) sendout during the week, with sendout volumes 64.8 percent below year-ago levels.
Storage
Working natural gas in storage increased to 2,512 Bcf as of Friday, April 13, according to EIA's WNGSR. This represents a net injection of 25 Bcf from the previous week. This week's injection is slightly less than the 5-year (2007-2011) average injection for the same week of 26 Bcf. Last year, during the same week, the implied net injection was 42 Bcf, likely because of warmer temperatures during the same week last year. Working inventories are currently 871 Bcf greater than their year-ago levels and 919 Bcf greater than the 5-year average.
All three storage regions posted increases this week. Inventories in the East Region increased by 13 Bcf; inventories in the West, by 5 Bcf; and inventories in the Producing Region, by 7 Bcf. Stocks in all three regions remain well above year-ago and five-year average levels. In the Producing Region, working natural gas inventories increased 1 Bcf in salt cavern facilities and increased 6 Bcf in the nonsalt cavern facilities.
Temperatures in the lower 48 States were close to normal, but cooler than the above-normal temperatures during the same week last year. The average temperature in the U.S. was 51.6 degrees, only 0.3 degrees off the 30-year normal of 51.3. While overall temperatures were close to normal, temperatures varied somewhat by Census Division. The West South Central and Mountain Census Divisions were both more than 4 degrees warmer than the 30-year normal, while the East South Central was 2.4 degrees cooler than normal.
See also:
California and Henry Hub Prices, April 2011 - April 2012
dollars per MMBTu
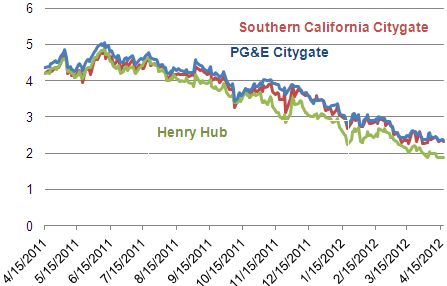
Source: Intelligence Press
| Spot Prices ($/MMBtu) | Thu, 12-Apr |
Fri, 13-Apr |
Mon, 16-Apr |
Tue, 17-Apr |
Wed, 18-Apr |
|---|---|---|---|---|---|
| Henry Hub | 1.87 |
1.87 |
1.88 |
1.89 |
1.87 |
| New York | 2.05 |
2.02 |
2.09 |
2.07 |
2.02 |
| Chicago | 2.01 |
1.94 |
2.00 |
2.00 |
2.00 |
| Cal. Comp. Avg,* | 2.18 |
2.12 |
2.16 |
2.15 |
2.16 |
| Futures ($/MMBtu) | |||||
| May Contract | 1.983 |
1.981 |
2.016 |
1.951 |
1.951 |
| June Contract | 2.092 |
2.084 |
2.108 |
2.048 |
2.042 |
| *Avg. of NGI's reported prices for: Malin, PG&E citygate, and Southern California Border Avg. | |||||
| Source: NGI's Daily Gas Price Index | |||||
| U.S. Natural Gas Supply - Gas Week: (4/11/12 - 4/18/12) | ||
|---|---|---|
Percent change for week compared with: |
||
last year |
last week |
|
| Gross Production | 5.70%
|
-0.56%
|
| Dry Production | 5.72%
|
-0.56%
|
| Canadian Imports | -6.66%
|
1.24%
|
| West (Net) | -8.41%
|
-3.62%
|
| MidWest (Net) | 14.61%
|
8.26%
|
| Northeast (Net) | -50.60%
|
-6.45%
|
| LNG Imports | -64.80%
|
-10.95%
|
| Total Supply | 3.91%
|
-0.47%
|
| Source: BENTEK Energy LLC | ||
| U.S. Consumption - Gas Week: (4/11/12 - 4/18/12) | ||
|---|---|---|
Percent change for week compared with: |
||
last year |
last week |
|
| U.S. Consumption | 6.78%
|
-4.47%
|
| Power | 37.72%
|
7.80%
|
| Industrial | -0.82%
|
-3.02%
|
| Residential/Commercial | -11.64%
|
-17.44%
|
| Total Demand | 6.12%
|
-4.42%
|
| Source: BENTEK Energy LLC | ||
Weekly natural gas rig count and spot Henry Hub
active rigs$ per MMBtu
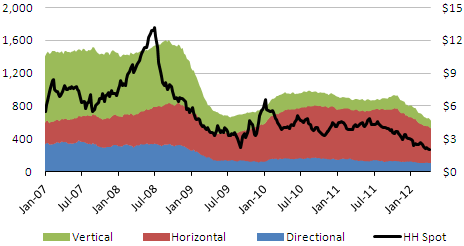
Source: Baker Hughes
| Rigs | |||
|---|---|---|---|
Fri, April 13, 2012 |
Change from |
||
last week |
last year |
||
| Oil Rigs | 1,322 |
-0.53% |
50.23% |
| Natural Gas Rigs | 624 |
-3.55% |
-29.49% |
| Miscellaneous | 4 |
33.33% |
-42.86% |
| Rig Numbers by Type | |||
|---|---|---|---|
Fri, April 13, 2012 |
Change from |
||
last week |
last year |
||
| Vertical | 568 |
-2.57% |
2.90% |
| Horizontal | 1,145 |
-1.72% |
14.16% |
| Directional | 237 |
2.60% |
9.22% |
| Source: Baker Hughes Inc. | |||
| Working Gas in Underground Storage | ||||
|---|---|---|---|---|
Stocks billion cubic feet (bcf) |
||||
| Region | 4/13/12
|
4/6/12
|
change |
|
| East | 1,105 |
1,092 |
13
|
|
| West | 358 |
353 |
5
|
|
| Producing | 1,049 |
1,042 |
7
|
|
| Total | 2,512 |
2,487 |
25
|
|
| Source: U.S. Energy Information Administration | ||||
| Working Gas in Underground Storage | |||||
|---|---|---|---|---|---|
Historical Comparisons |
|||||
Year ago (4/13/11) |
5-year average (2007-2011) |
||||
| Region | Stocks (Bcf) |
% change |
Stocks (Bcf) |
% change |
|
| East | 644 |
71.6 |
673 |
64.2 |
|
| West | 222 |
61.3 |
247 |
44.9 |
|
| Producing | 775 |
35.4 |
673 |
55.9 |
|
| Total | 1,641 |
53.1 |
1,593 |
57.7 |
|
| Source: U.S. Energy Information Administration | |||||
| Temperature -- Heating & Cooling Degree Days (week ending Apr 12) | ||||||||
|---|---|---|---|---|---|---|---|---|
HDD deviation from: |
CDD deviation from: |
|||||||
| Region | HDD Current |
normal |
last year |
CDD Current |
normal |
last year |
||
| New England | 142
|
-7
|
15
|
0
|
0
|
0
|
||
| Middle Atlantic | 128
|
-3
|
17
|
0
|
0
|
0
|
||
| E N Central | 139
|
4
|
50
|
0
|
0
|
-1
|
||
| W N Central | 129
|
2
|
54
|
0
|
-1
|
-5
|
||
| South Atlantic | 77
|
11
|
36
|
15
|
2
|
-14
|
||
| E S Central | 73
|
12
|
51
|
0
|
-5
|
-27
|
||
| W S Central | 14
|
-16
|
4
|
31
|
14
|
-21
|
||
| Mountain | 93
|
-30
|
-34
|
6
|
0
|
4
|
||
| Pacific | 80
|
9
|
-29
|
0
|
-2
|
0
|
||
| United States | 101
|
0
|
18
|
7
|
2
|
-7
|
||
|
Note: HDD = heating degree-day; CDD = cooling degree-day Source: National Oceanic and Atmospheric Administration | ||||||||
Average temperature (°F)
7-Day Mean ending Apr 12, 2012
Source: NOAA/National Weather Service
Deviation between average and normal (°F)
7-Day Mean ending Apr 12, 2012
Source: NOAA/National Weather Service
Monthly dry shale gas production
billion cubic feet per day
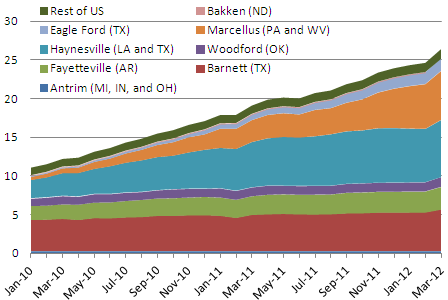
Source: Lippman Consulting, Inc. Gross withdrawal estimates are as of March 2012 and converted to dry production estimates with EIA-calculated average.