In the News:
Winter Weather Leads to Spike in Natural Gas Consumption
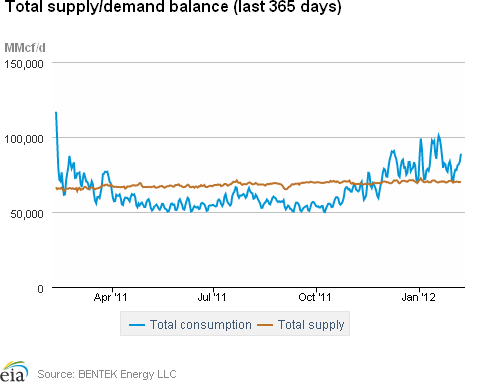
Although the winter has been unseasonably warm through most of the lower 48 States, cold temperatures on Sunday led to increases in consumption, imports, and LNG sendout according to estimates from BENTEK Energy, LLC (Bentek). Total U.S. consumption rose to more than 104 billion cubic feet (Bcf) on Sunday, the highest level of the winter so far. Imports from Canada and LNG sendout each of which has been very low this year increased during the weekend, filling in as a marginal source of supply. LNG sendout rose to 1.2 Bcf on Sunday and Monday, with sendout coming from four separate terminals (last report week, LNG sendout averaged 0.6 Bcf per day).
This winter has been unusually warm, which has been reflected in lower natural gas consumption the five-year (2007 2011) average for January consumption, according to both EIA and Bentek data, is 87.7 Bcf per day, about 4 percent greater than Bentek's January 2012 average of 83.9 Bcf per day. Bentek's five-year average of consumption for February 1 15 is about 87.2 Bcf; even with the weekend's cold snap, February 1 15 2012 consumption averaged about 3 percent below that, at 84.8 Bcf per day. Despite power burn consistently at levels much greater than last year, the overall level of consumption is down, reflecting a weather-related decline in consumption.
Overview:
(For the Week Ending Wednesday, February 15, 2012)
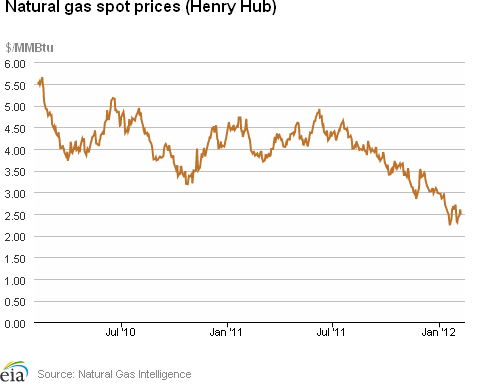
- With the exception of the Northeast, which experienced significant price increases as a cold spell brought lower than normal temperatures into the region over the weekend, prices across the country in general remained fairly level over the week. The Henry Hub price closed at $2.54 per million British thermal units (MMBtu) on February 15, up 5 cents for the week.
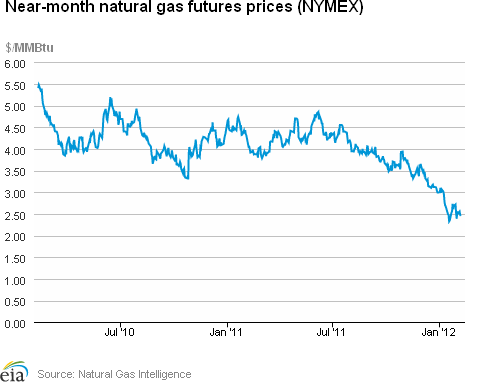
- At the New York Mercantile Exchange (NYMEX), the March 2012 natural gas contract also traded within a narrow range, finishing the week with a decline of 2.3 cents per MMBtu to close at $2.425 per MMBtu.
- Working natural gas in storage was 2,761 Bcf as of Friday, February 10, according to the U.S. Energy Information Administration's (EIA) Weekly Natural Gas Storage Report (WNGSR). The implied net withdrawal for the week was 127 Bcf, positioning storage volumes 817 Bcf above year-ago levels.
- The natural gas rotary rig count, as reported February 10 by Baker Hughes Incorporated, declined by 25 to 720 active rigs. Meanwhile, oil-directed rigs increased by 18 to 1,263. Overall, the gas rig count is 21 percent lower than a year ago, and the oil rig count is 57 percent higher.
Prices:
Prices over the report week were relatively stable across most of the country, with the Henry Hub day-ahead price trading within a 6 cent range over the week and in the end gaining a modest 2.0 percent, increasing from $2.49 per MMBtu the previous Wednesday to $2.54 per MMBtu yesterday. The exception was the Northeast, which seemed to be on a roller-coaster ride as substantial gains on Friday in likely anticipation of severe winter weather were followed by declines of a similar magnitude on Monday as the cold weather was replaced by more moderate temperatures. The Algonquin city gate price for delivery into Boston jumped from $3.74 per MMBtu on Thursday to $5.30 per MMBtu (42 percent) on Friday, only to retreat to $3.42 per MMBtu (35 percent) by Monday, and subsequently to close the week at $3.27 per MMBtu, down 72 cents from the previous Wednesday. Similarly, prices at Transcontinental Pipeline's Zone 6 trading point for delivery into New York City jumped from $2.92 per MMBtu on Thursday to $5.54 per MMBtu (90 percent) on Friday, retreated to $2.88 per MMBtu (48 percent) on Monday, and closed out the week at $2.84 per MMBtu, down 7 cents from the previous Wednesday.
At the NYMEX, the March 2012 contract traded within a 10.7 cent range and declined slightly over the week, from $2.448 per MMBtu last Wednesday to $2.425 per MMBtu yesterday, a drop of 2.3 cents (0.9 percent). The contract peaked on Tuesday at $2.532 per MMBtu (up 4.2 percent from the previous day), despite forecasts for milder temperatures and ample storage levels.
Colder temperatures, most notably over the weekend in the East, contributed to a significant increase in consumption for the week. According to estimates from Bentek, domestic natural gas consumption rose by 14.3 percent from last week, topping 100 Bcf on both Saturday and Sunday and averaging 91.7 Bcf over the week. While industrial and power sector consumption remained relatively steady over the week, the residential/commercial sector consumption jumped from 42.7 Bcf on Friday to 53.4 Bcf (24.9 percent) on Saturday and remained high on Sunday before beginning to ease off on Monday. The residential/commercial sector gained 21.1 percent overall for the week, while the power sector rose 12.3 percent, and industrial sector consumption registered a more modest 3.7 percent increase. The increases in power burn occurred predominately over the weekend in the Southeast, Texas, and Midcontinent regions, all of which experienced colder-than-normal weather.
Although dry gas production was down for the week, total supply showed a slight increase. According to Bentek estimates, the week's average total dry natural gas production posted a 0.6 percent decline. With a 6.0 percent increase in imports from Canada and a 42.1 percent increase in LNG sendout, however, there was an overall increase in supply of 0.2 percent for the week. The bulk of the increased imports from Canada were in the Northeast, and the bulk of the increased LNG sendout was along the east coast at the Everett, Massachusetts, Cove Point, Maryland, and Elba Island, Georgia terminals, likely a result of the weekend cold snap that covered most of the East. Even with the increased import levels, imports from Canada stand 18.9 percent below year-ago volumes for the same week, and LNG imports stand 38.8 percent below year-ago levels.
Storage
Working natural gas in storage fell to 2,761 Bcf as of Friday, February 10, according to EIA's WNGSR. This represents an implied net withdrawal of 127 Bcf from the previous week, which is 29 percent less than the 5-year average implied net withdrawal of 178 Bcf. Inventories in all three regions posted declines, with the East region contributing the most to this week's implied net withdrawal, with a decrease of 83 Bcf (a 5.9 percent decline from the previous week's level).
Stocks were 765 Bcf higher than the 5-year average level and 817 Bcf higher than last year at this time. Inventories in the Producing Region remain above the 5-year average of 686 Bcf by 365 Bcf (53.2 percent). Stocks in the East and West Regions are also above their 5-year averages by 302 Bcf (29.4 percent) and 99 Bcf (35.1 percent), respectively.
Temperatures during the week ending February 9 were 5.6 degrees warmer than the 30-year normal temperature and 9.9 degrees warmer than the same period last year. During the week all regions with the exception of the Mountain region were warmer than normal. The Midwest was particularly warm, with the East North Central and West North Central regions averaging 8.3 and 7.6 degrees warmer than normal, respectively. The average temperature in the Mountain region in the West was 0.7 degrees cooler than normal. Heating degree-days nationwide were down 17.4 percent from normal and 28.0 percent from last year.
See also:
Winter U.S. Natural Gas Consumption, 2011-2012 and the 5-Year Average
billion cubic feet per day
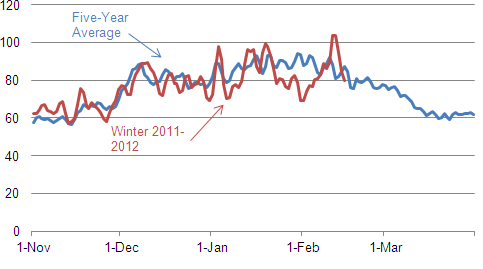
Source: Bentek Energy LLC
Note: The five-year average refers to the average of gas consumption for each day between the 2006-2007 winter and the 2010-2011 winter.
| Spot Prices ($/MMBtu) | Thu, 09-Feb |
Fri, 10-Feb |
Mon, 13-Feb |
Tue, 14-Feb |
Wed, 15-Feb |
|---|---|---|---|---|---|
| Henry Hub | 2.50 |
2.51 |
2.42 |
2.48 |
2.54 |
| New York | 2.92 |
5.54 |
2.88 |
2.80 |
2.84 |
| Chicago | 2.65 |
2.69 |
2.60 |
2.64 |
2.66 |
| Cal. Comp. Avg,* | 2.74 |
2.73 |
2.74 |
2.76 |
2.79 |
| Futures ($/MMBtu) | |||||
| March Contract | 2.477 |
2.477 |
2.431 |
2.532 |
2.425 |
| April Contract | 2.636 |
2.656 |
2.620 |
2.700 |
2.616 |
| *Avg. of NGI's reported prices for: Malin, PG&E citygate, and Southern California Border Avg. | |||||
| Source: NGI's Daily Gas Price Index | |||||
| Working Gas in Underground Storage | ||||
|---|---|---|---|---|
Stocks billion cubic feet (bcf) |
||||
| Region | 2/10/12
|
2/3/12
|
change |
|
| East | 1,329 |
1,412 |
-83
|
|
| West | 381 |
388 |
-7
|
|
| Producing | 1,051 |
1,088 |
-37
|
|
| Total | 2,761 |
2,888 |
-127
|
|
| Source: U.S. Energy Information Administration | ||||
| Working Gas in Underground Storage | |||||
|---|---|---|---|---|---|
Historical Comparisons |
|||||
Year ago (2/10/11) |
5-year average (2007-2011) |
||||
| Region | Stocks (Bcf) |
% change |
Stocks (Bcf) |
% change |
|
| East | 954 |
39.3 |
1,027 |
29.4 |
|
| West | 279 |
36.6 |
282 |
35.1 |
|
| Producing | 711 |
47.8 |
686 |
53.2 |
|
| Total | 1,944 |
42.0 |
1,996 |
38.3 |
|
| Source: U.S. Energy Information Administration | |||||
| Temperature -- Heating & Cooling Degree Days (week ending Feb 09) | ||||||||
|---|---|---|---|---|---|---|---|---|
HDD deviation from: |
CDD deviation from: |
|||||||
| Region | HDD Current |
normal |
last year |
CDD Current |
normal |
last year |
||
| New England | 230
|
-39
|
-43
|
0
|
0
|
0
|
||
| Middle Atlantic | 212
|
-46
|
-48
|
0
|
0
|
0
|
||
| E N Central | 225
|
-58
|
-104
|
0
|
0
|
0
|
||
| W N Central | 238
|
-53
|
-116
|
0
|
0
|
0
|
||
| South Atlantic | 136
|
-36
|
-53
|
11
|
4
|
5
|
||
| E S Central | 126
|
-46
|
-94
|
0
|
0
|
0
|
||
| W S Central | 104
|
-18
|
-106
|
4
|
0
|
4
|
||
| Mountain | 218
|
4
|
-42
|
0
|
-1
|
0
|
||
| Pacific | 91
|
-17
|
-6
|
0
|
0
|
0
|
||
| United States | 175
|
-37
|
-68
|
3
|
2
|
1
|
||
|
Note: HDD = heating degree-day; CDD = cooling degree-day Source: National Oceanic and Atmospheric Administration | ||||||||
Average temperature (°F)
7-Day Mean ending Feb 09, 2012
Source: NOAA/National Weather Service
Deviation between average and normal (°F)
7-Day Mean ending Feb 09, 2012
Source: NOAA/National Weather Service
| U.S. Natural Gas Supply - Gas Week: (2/8/12 - 2/15/12) | ||
|---|---|---|
Percent change for week compared with: |
||
last year |
last week |
|
| Gross Production | 9.69%
|
-0.57%
|
| Dry Production | 10.87%
|
-0.64%
|
| Canadian Imports | -18.93%
|
5.99%
|
| West (Net) | -2.73%
|
-0.90%
|
| MidWest (Net) | -22.55%
|
4.98%
|
| Northeast (Net) | -32.56%
|
18.57%
|
| LNG Imports | -38.80%
|
42.12%
|
| Total Supply | 6.60%
|
0.24%
|
| Source: BENTEK Energy LLC | ||
| U.S. Consumption - Gas Week: (2/8/12 - 2/15/12) | ||
|---|---|---|
Percent change for week compared with: |
||
last year |
last week |
|
| U.S. Consumption | 3.86%
|
14.35%
|
| Power | 30.98%
|
12.30%
|
| Industrial | 0.65%
|
3.67%
|
| Residential/Commercial | -5.49%
|
21.07%
|
| Total Demand | 3.81%
|
14.26%
|
| Source: BENTEK Energy LLC | ||
Weekly natural gas rig count and spot Henry Hub
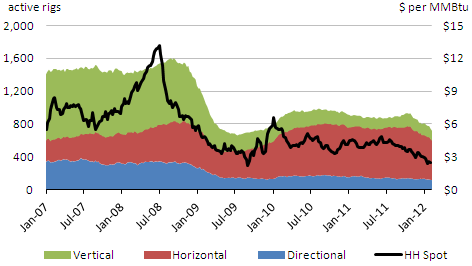
Source: Baker Hughes
| Rigs | |||
|---|---|---|---|
Fri, February 10, 2012 |
Change from |
||
last week |
last year |
||
| Oil Rigs | 1,263 |
1.45% |
54.66% |
| Natural Gas Rigs | 720 |
-3.36% |
-17.77% |
| Miscellaneous | 6 |
-14.29% |
-30.00% |
| Rig Numbers by Type | |||
|---|---|---|---|
Fri, February 10, 2012 |
Change from |
||
last week |
last year |
||
| Vertical | 603 |
-0.50% |
17.44% |
| Horizontal | 1,171 |
-0.26% |
19.80% |
| Directional | 215 |
-0.92% |
-3.56% |
| Source: Baker Hughes Inc. | |||
Monthly dry shale gas production
trillion cubic feet
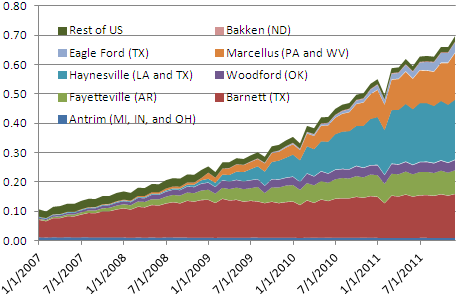
Source: Lippmann Consulting, Inc. Gross withdrawal estimates as of December 2011 and converted to dry production estimates with EIA-calculated average.