In the News:
Cold and Dry Winter Drives Up Natural Gas Burn in the Pacific Northwest
While most of the United States has experienced a much warmer-than-normal winter, the Pacific Northwest has actually been cold and dry this year, leading to increased use of natural gas for power generation and a forecast for less hydropower supply this summer, according to recent analysis by BENTEK Energy, LLC (Bentek). Bentek reported that forecasts by the Northwest River Forecast Center for the water supply for the 2012 hydro year are about 91 percent of normal levels, a turnaround from last year, when oversupply of hydro led regulators to curtail thermal and wind generation.
Average year-to-date 2012 power burn in the Pacific Northwest (although relatively small to begin with, as the result of the region's hydroelectric infrastructure) has close to doubled compared to last year; power burn has averaged 590.7 million cubic feet per day (MMcf/d) so far in 2012, compared to 299.2 MMcf/d from January 1 – February 8, 2011. (However, in 2011, natural gas power burn in the Pacific Northwest was lower than the five year average.)
Although natural gas prices at the Sumas hub have fallen from last year, prices have seen increases this month. Additionally, the basis to the Henry Hub has risen substantially in the past several months. Last year, on average, Sumas prices traded below Henry Hub prices; this pattern has reversed in the past several months. Also putting upward pressure on Sumas prices is maintenance on a compressor station on Northwest Pipeline's system. The Willard Compressor Station has been limiting supply from the Rocky Mountains and Alberta this week, according to Bentek analysis.
Overview:
(For the Week Ending Wednesday, February 8, 2012)
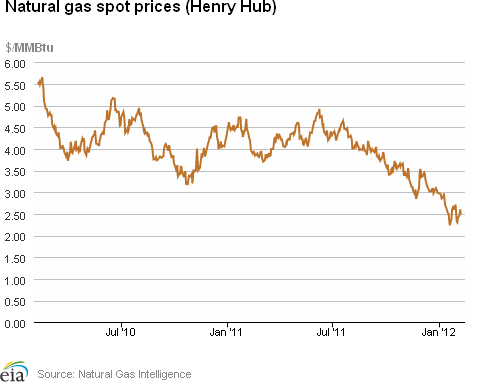
- A temporary return to more normal seasonal temperatures was likely the catalyst that caused natural gas prices to reverse their recent multi-week downtrend. The Henry Hub price closed at $2.49 per million British thermal units (MMBtu) on February 8, up 17 cents for the week.
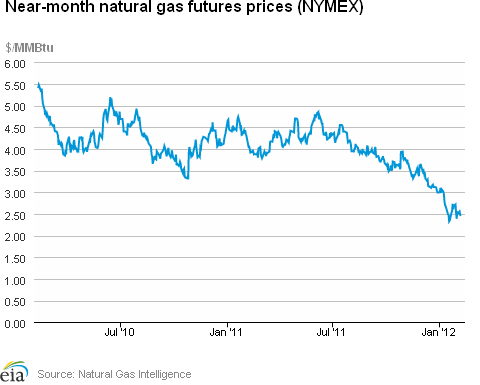
- At the New York Mercantile Exchange (NYMEX), the March 2012 natural gas contract rose 6.6 cents per MMBtu for the week to close at $2.448 per MMBtu.
- Working natural gas in storage eased slightly last week to 2,888 billion cubic feet (Bcf) as of Friday, February 3, according to the U.S. Energy Information Administration's (EIA) Weekly Natural Gas Storage Report (WNGSR). The implied net withdrawal for the week was 78 Bcf, positioning storage volumes 714 Bcf above year-ago levels.
- The natural gas rotary rig count, as reported February 3 by Baker Hughes Incorporated, decreased by 32 to 745 active units. Meanwhile, oil-directed rigs increased by 20 to 1,245 units.
Prices:
Movement in the Henry Hub day-ahead price echoed the widespread increase of market prices in this week's cash market by rising 7.3 percent, from $2.32 per MMBtu the previous Wednesday to $2.49 per MMBtu yesterday. As the Spot Prices tab on the left shows, the Henry Hub cash price trended upwards nearly every day of the week, except Wednesday, as all end-use natural gas market segments increased their consumption.
At the NYMEX, the March 2012 contract rose from $2.382 per MMBtu last Wednesday to $2.448 per MMBtu yesterday, an increase of 6.6 cents (2.8 percent). The March 2012 contract peaked on Thursday at $2.554 per MMBtu (up 7.2 percent) with the arrival of the colder weather, but began a gradual decline afterwards likely on forecasts for the return of milder temperatures set against a backdrop of ample national storage lingering into spring.
All downstream trading locations responded with higher prices from increased weather load this week. Spot prices at Transcontinental Pipeline's Zone 6 trading point for delivery into New York City, which started the week at $2.70 per MMBtu , showed a $0.21 per MMBtu price gain over the week (Wednesday to Wednesday) to close at $2.91 per MMBtu (up 7.8 percent). Over the same period, and experiencing similar weather patterns, the Chicago citygate spot price registered a smaller 17 cent per MMBtu price gain (from $2.43 per MMBtu last Wednesday), ending the week at $2.60 per MMBtu (up 7.0 percent).
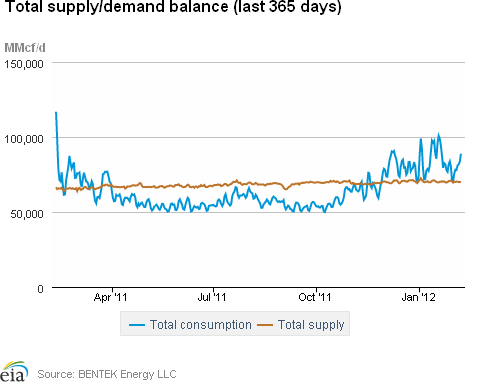
In the midst of more normal seasonal temperatures, consumption posted an expected increase for the week. According to estimates from Bentek, domestic natural gas consumption rose by 4.8 percent from last week. The residential/commercial sector led the increase with an 8.5 percent gain, while the industrial sector tallied a 1.6 percent rise. The power sector posted a 1.9 percent increase, confirming the increased weather load.
Total supply was down slightly for the week with a decline in dry gas production. According to Bentek estimates, the week's average total natural gas supply posted a 0.3 percent decline from last week's level led by a small decrease in dry gas production. Domestic weekly dry gas production averaged 64.0 Bcf per day, 0.4 percent lower than the previous week and 19.5 percent above this time last year. The slight loss in this week's dry gas production was partially offset by a 0.6 percent increase in imports from Canada, which averaged 5.5 Bcf per day over the period. Imports from Canada stand 29.5 percent below year-ago volumes for the same week. There were also modest supply losses registered in the liquefied natural gas (LNG) arena during the week, where imports averaged 571 MMcf/d, remaining 49.4 percent below year-ago levels.
Storage
Working natural gas in storage fell to 2,888 Bcf as of Friday, February 3, according to EIA's WNGSR. This represents an implied net withdrawal of 78 Bcf from the previous week, which is 59 percent less than the 5-year average implied net withdrawal of 191 Bcf. Inventories in all three regions posted declines, with the East region contributing the most to this week's implied net withdrawal, with a decrease of 59 Bcf (a 4.0 percent decline from the previous week's level).
Stocks were 714 Bcf higher than both the 5-year average level and the storage level from last year at this time; both of which were 2,174 Bcf. Inventories in the Producing Region remain above the 5-year average of 737 Bcf by 351 Bcf (47.6 percent). Stocks in the East and West Regions are also above their 5-year averages by 276 Bcf (24.3 percent) and 87 Bcf (28.9 percent), respectively.
Temperatures during the week ending February 2 were 9.7 degrees warmer than the 30-year normal temperature and 9.9 degrees warmer than the same period last year. At the national level, the average temperature was higher than the 30-year average by a greater margin than the last 12 weeks of warmer-than-normal temperatures. During the week all regions were warmer than normal, particularly the West North Central and East North Central regions in the Midwest and the Middle Atlantic region in the Northeast, averaging 14.4, 13.0, and 13.0 degrees above normal, respectively. Heating degree-days nationwide were down 31.1 percent from normal and 31.1 percent from last year.
See also:
Sumas and Henry Hub Prices, Jan. 2011 - Feb. 2012
dollars per MMBtu
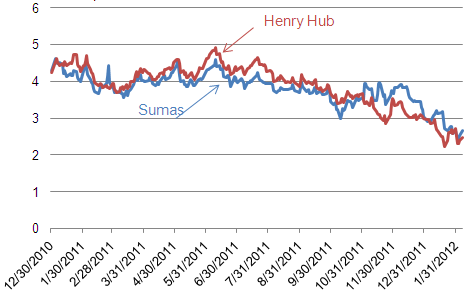
Source: Natural Gas Intelligence
| Spot Prices ($/MMBtu) | Thu, 02-Feb |
Fri, 03-Feb |
Mon, 06-Feb |
Tue, 07-Feb |
Wed, 08-Feb |
|---|---|---|---|---|---|
| Henry Hub | 2.30 |
2.40 |
2.47 |
2.60 |
2.49 |
| New York | 2.71 |
2.76 |
2.90 |
3.23 |
2.91 |
| Chicago | 2.45 |
2.58 |
2.64 |
2.76 |
2.60 |
| Cal. Comp. Avg,* | 2.62 |
2.71 |
2.82 |
2.92 |
2.75 |
| Futures ($/MMBtu) | |||||
| March Contract | 2.554 |
2.499 |
2.550 |
2.472 |
2.448 |
| April Contract | 2.715 |
6.677 |
2.738 |
2.628 |
2.598 |
| *Avg. of NGI's reported prices for: Malin, PG&E citygate, and Southern California Border Avg. | |||||
| Source: NGI's Daily Gas Price Index | |||||
| Working Gas in Underground Storage | ||||
|---|---|---|---|---|
Stocks billion cubic feet (bcf) |
||||
| Region | 2/3/12
|
1/27/12
|
change |
|
| East | 1,412 |
1,471 |
-59
|
|
| West | 388 |
396 |
-8
|
|
| Producing | 1,088 |
1,099 |
-11
|
|
| Total | 2,888 |
2,966 |
-78
|
|
| Source: U.S. Energy Information Administration | ||||
| Working Gas in Underground Storage | |||||
|---|---|---|---|---|---|
Historical Comparisons |
|||||
Year ago (2/3/11) |
5-year average (2007-2011) |
||||
| Region | Stocks (Bcf) |
% change |
Stocks (Bcf) |
% change |
|
| East | 1,071 |
31.8 |
1,136 |
24.3 |
|
| West | 305 |
27.2 |
301 |
28.9 |
|
| Producing | 799 |
36.2 |
737 |
47.6 |
|
| Total | 2,174 |
32.8 |
2,174 |
32.8 |
|
| Source: U.S. Energy Information Administration | |||||
| Temperature -- Heating & Cooling Degree Days (week ending Feb 02) | ||||||||
|---|---|---|---|---|---|---|---|---|
HDD deviation from: |
CDD deviation from: |
|||||||
| Region | HDD Current |
normal |
last year |
CDD Current |
normal |
last year |
||
| New England | 186
|
-87
|
-112
|
0
|
0
|
0
|
||
| Middle Atlantic | 171
|
-91
|
-97
|
0
|
0
|
0
|
||
| E N Central | 200
|
-91
|
-89
|
0
|
0
|
0
|
||
| W N Central | 203
|
-101
|
-106
|
0
|
0
|
0
|
||
| South Atlantic | 109
|
-69
|
-56
|
8
|
1
|
5
|
||
| E S Central | 118
|
-63
|
-33
|
0
|
-1
|
0
|
||
| W S Central | 79
|
-51
|
-51
|
5
|
1
|
4
|
||
| Mountain | 188
|
-35
|
-54
|
0
|
-1
|
0
|
||
| Pacific | 93
|
-19
|
-20
|
0
|
-1
|
0
|
||
| United States | 151
|
-68
|
-68
|
2
|
0
|
1
|
||
|
Note: HDD = heating degree-day; CDD = cooling degree-day Source: National Oceanic and Atmospheric Administration | ||||||||
Average temperature (°F)
7-Day Mean ending Feb 02, 2012
Source: NOAA/National Weather Service
Deviation between average and normal (°F)
7-Day Mean ending Feb 02, 2012
Source: NOAA/National Weather Service
| U.S. Natural Gas Supply - Gas Week: (2/1/12 - 2/8/12) | ||
|---|---|---|
Percent change for week compared with: |
||
last year |
last week |
|
| Gross Production | 17.27%
|
-0.33%
|
| Dry Production | 19.50%
|
-0.36%
|
| Canadian Imports | -29.47%
|
0.61%
|
| West (Net) | 1.41%
|
3.52%
|
| MidWest (Net) | -44.59%
|
-10.46%
|
| Northeast (Net) | -45.15%
|
6.73%
|
| LNG Imports | -49.41%
|
-0.37%
|
| Total Supply | 12.12%
|
-0.29%
|
| Source: BENTEK Energy LLC | ||
| U.S. Consumption - Gas Week: (2/1/12 - 2/8/12) | ||
|---|---|---|
Percent change for week compared with: |
||
last year |
last week |
|
| U.S. Consumption | -17.35%
|
4.82%
|
| Power | -0.03%
|
1.93%
|
| Industrial | -4.41%
|
1.63%
|
| Residential/Commercial | -29.30%
|
8.45%
|
| Total Demand | -17.01%
|
4.70%
|
| Source: BENTEK Energy LLC | ||
Weekly natural gas rig count and spot Henry Hub
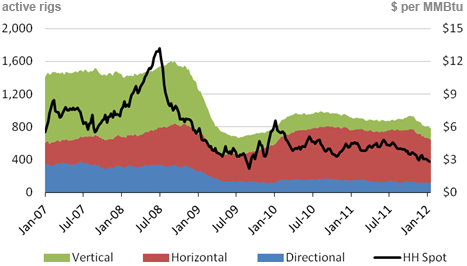
Source: Baker Hughes
| Rigs | |||
|---|---|---|---|
Fri, February 03, 2012 |
Change from |
||
last week |
last year |
||
| Oil Rigs | 1,245 |
1.63% |
49.76% |
| Natural Gas Rigs | 745 |
-4.12% |
-14.71% |
| Miscellaneous | 7 |
16.67% |
-40.00% |
| Rig Numbers by Type | |||
|---|---|---|---|
Fri, February 03, 2012 |
Change from |
||
last week |
last year |
||
| Vertical | 606 |
0.00% |
14.56% |
| Horizontal | 1,174 |
-0.93% |
20.80% |
| Directional | 217 |
0.00% |
-5.24% |
| Source: Baker Hughes Inc. | |||
Monthly dry shale gas production
trillion cubic feet
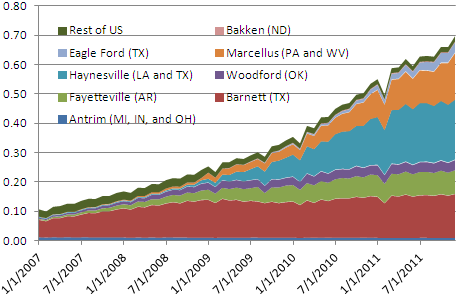
Source: Lippmann Consulting, Inc. Gross withdrawal estimates as of December 2011 and converted to dry production estimates with EIA-calculated average.