In the News:
In The News: Liquids Driving Exploration and Production Decisions
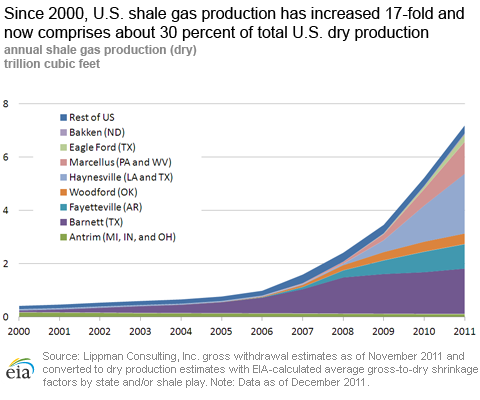
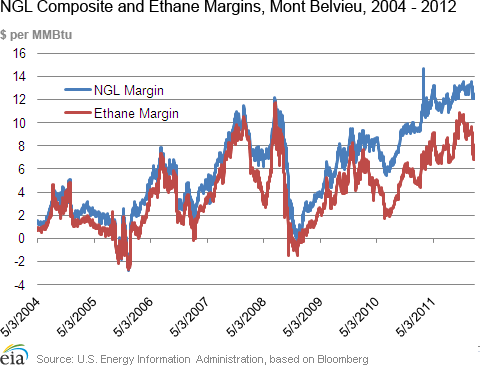
The profitability of natural gas liquids (NGLs, which include fuels such as ethane, normal butane, isobutane, and propane) has, in recent years, led operators to focus drilling efforts on so-called 'wet' production areas where NGLs are relatively abundant. These areas include portions of shale formations such as the Eagle Ford in Texas, the Marcellus in Pennsylvania, and the Utica in Ohio, which underlies the Marcellus. Although both oil and gas prices dropped considerably from their 2008 highs, oil prices have since somewhat rebounded, while natural gas prices have remained relatively low, with NYMEX futures prices hitting 10-year lows and remaining below $3 per million British thermal units (MMBtu). NGL prices, which more closely mirror the price of crude oil, have been rising over the past couple of years.
The figure shows the indicated NGL price minus the natural gas price at the Henry Hub. (When below zero, this means that the natural gas price was above the indicated liquids price, such as in 2005, when Hurricanes Katrina and Rita led to Henry Hub price spikes.) The price of ethane, the most abundant and widely produced NGL, behaves somewhat differently from other NGL price series, and is tied more closely to natural gas prices.
Overview:
(For the Week Ending Wednesday, January 25, 2012)
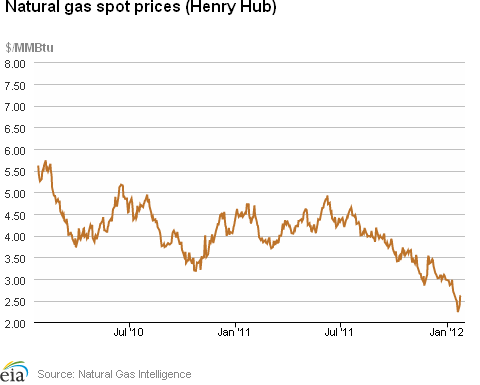
- Spot prices at most market locations fell early during the report week (Wednesday, January 18 to Wednesday, January 25), only to reverse the trend on Monday and end the report week up. The Henry Hub spot price increased 12 cents over the week, from $2.49 per MMBtu last Wednesday to $2.61 per MMBtu yesterday.
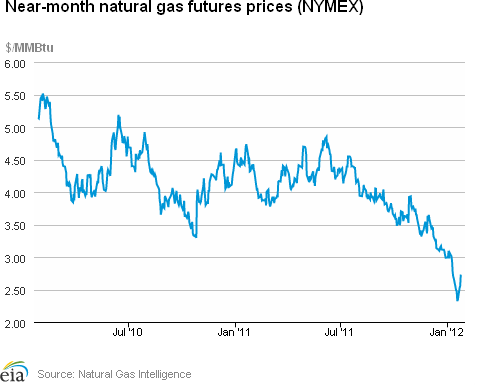
- The New York Mercantile Exchange followed a similar pattern, with the near-month contract (February) increasing 25.7 cents, from $2.472 per MMBtu last Wednesday to $2.729 yesterday.
- Working natural gas in storage fell last week to 3,098 billion cubic feet (Bcf) as of Friday, January 20, according to the U.S. Energy Information Administration's (EIA) Weekly Natural Gas Storage Report (WNGSR). The implied net withdrawal for the week was 192 Bcf, positioning storage volumes 531 Bcf above year-ago levels.
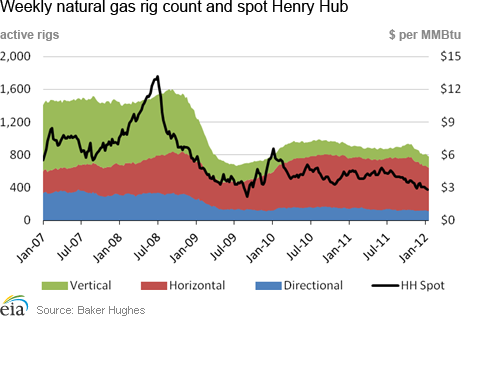
- The natural gas rotary rig count, as reported by Baker Hughes Incorporated on January 20, fell by 11 to 780. The count for oil-directed rigs increased by 32 to 1,223. While the gas rig count is 14 percent lower than this week last year, the oil rig count is up by 53 percent.
Prices:
Natural gas prices began the report week on a decline, with most points across the country experiencing double digit decreases Thursday and Friday, likely due to high storage levels and relatively mild temperatures across most of the country. The Henry Hub price fell 26 cents by Friday, dropping from $2.49 per MMBTU last Wednesday to $2.23 per MMBtu on Friday, with similar declines seen at most trading points across the country. On Monday, the trend reversed and remained on an upswing for the remainder of the report week. Tuesday saw price increases at virtually every trading point across the country, most of which continued into Wednesday, with most points ending the week slightly above last Wednesday's closing prices. The Henry Hub price gained 38 cents between last Friday and yesterday to end the week at $2.61 per MMBtu, up 12 cents overall for the report week.
The Northeast was the exception to the trend seen in the rest of the country, posting much steeper declines than other areas early in the week as prices backed off from the previous week's relatively large gains. While most decreases across the country on Thursday and Friday were under 20 cents and were followed by a slight upswing on Monday, the large gains seen in the Northeast the preceding report week dissipated as cold weather gave way to unseasonably mild temperatures and prices backed off considerably through Monday's trading. The price at the Algonquin Citygate for delivery to Boston dropped $1.87 per MMBtu (33 percent), from $5.61 per MMBtu last Wednesday to $3.74 per MMBtu on Monday, while Transcontinental Pipeline's Zone 6 for delivery into New York City dropped $2.29 per MMBtu (44 percent), from $5.21 per MMBtu last Wednesday to $2.92 per MMBtu on Monday. By Tuesday, likely due to concern over forecasts that a cold front was expected to move across the region, prices gave back some of the earlier-in-the-week declines and rebounded by more than 40 cents per MMBtu at both the Algonquin Citygate and Transcontinental's Zone 6 pricing points. Prices in the Northeast were mixed yesterday, with about half the region's pricing points, including the Algonquin Citygate and Transco Zone 6, seeing declines ranging from 19 to 47 cents per MMBtu. Most of the other pricing points in the region, such as the Leidy Hub in Pennsylvania and Tennessee Gas Pipeline's Niagara in northwest New York, showed single-digit increases, consistent with the magnitude of the increases across the rest of the country.
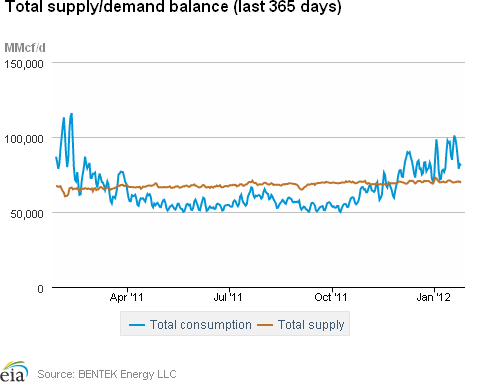
Both supply and consumption decreased this week. Dry natural gas production remained relatively flat over the week, according to estimates from BENTEK Energy, LLC (Bentek), declining overall by 0.3 percent from last week's level. However, dry gas production continues to remain well above year-ago levels, exceeding them by 8.2 percent. Imports from Canada declined by 4.4 percent and LNG sendout declined by 3.2 percent week over week. Imports from Canada and LNG imports are more than 31 percent below last year's levels for the same week. While total consumption was down by 4.3 percent from the previous week, with power burn and residential/commercial consumption showing the largest decreases, total consumption dropped 15.8 percent between last Wednesday and yesterday as colder temperatures earlier in the week gave way to warmer weather. Power burn and residential/commercial consumption led the decline over the week as the need for natural gas and natural gas-fired electric power for space heating declined. Total consumption ended the report week 9.3 percent below last year's levels.
At the NYMEX, prices increased over the week. The near-month (February 2012) futures contract, which expires Monday, increased from 2.472 per MMBtu last Wednesday to $2.729 per MMBtu yesterday, an increase of slightly over 10 percent. The March 2012 contract, which will move into the near-month position when the February contract expires on Monday, also increased by slightly over 10 percent, moving from 2.516 per MMBtu last Wednesday to 2.769 per MMBtu yesterday. The 12-month strip, the average of the 12 contracts between February 2012 and January 2013, increased from $2.848 per MMBtu last Wednesday to $3.120 per MMBtu yesterday, an increase of slightly less than 10 percent.
Storage
Working natural gas in storage fell to 3,098 Bcf as of Friday, January 20, according to EIA's WNGSR. This represents an implied net withdrawal of 192 Bcf. This is the largest implied net withdrawal of this year's heating season and is 11 percent greater than the 5-year average implied net withdrawal of 173 Bcf. Inventories in all three regions posted declines, with the East region contributing the most to this week's implied net withdrawal, with a decrease of 122 Bcf (a 7 percent decline from the previous week).
Despite the strong implied net withdrawal, stocks were 547 Bcf higher than the 5-year average level of 2,551Bcf, and 531 Bcf higher than last year at this time. Inventories in the Producing Region continue to stand out at 284 Bcf (33.9 percent) above the 5-year average of 837 Bcf. Stocks in the East and West Regions were above their 5-year averages by 202 Bcf (14.8 percent) and 61 Bcf (17.7 percent), respectively.
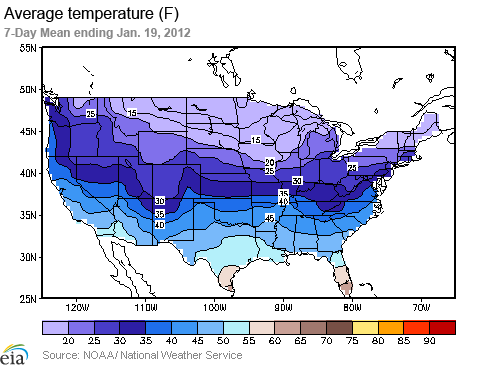
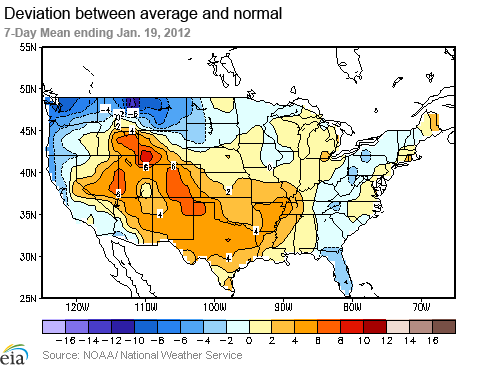
Temperatures during the week ending January 19 were 1.1 degrees warmer than the 30-year normal temperature and 1.0 degrees warmer than the same period last year. During the week, temperatures were a few degrees warmer than normal in most Census Divisions, with the exception of the South Atlantic and the Pacific Divisions, where temperatures were 0.4 and 1.7 degrees cooler than normal, respectively. Heating degree-days nationwide were down 4.0 percent from normal and 3.1 percent from last year.
See also:
| Spot Prices ($/MMBtu) | Thu, 19-Jan |
Fri, 20-Jan |
Mon, 23-Jan |
Tue, 24-Jan |
Wed, 25-Jan |
|---|---|---|---|---|---|
| Henry Hub | 2.36 |
2.23 |
2.38 |
2.60 |
2.61 |
| New York | 5.19 |
4.12 |
2.92 |
3.37 |
3.18 |
| Chicago | 2.56 |
2.40 |
2.61 |
2.72 |
2.73 |
| Cal. Comp. Avg,* | 2.70 |
2.61 |
2.78 |
2.89 |
2.91 |
| Futures ($/MMBtu) | |||||
| February delivery | 2.322 |
2.343 |
2.525 |
2.554 |
2.729 |
| March delivery | 2.363 |
2.392 |
2.580 |
2.601 |
2.769 |
| *Avg. of NGI's reported prices for: Malin, PG&E citygate, and Southern California Border Avg. | |||||
| Source: NGI's Daily Gas Price Index | |||||
| Working Gas in Underground Storage | ||||
|---|---|---|---|---|
Stocks billion cubic feet (bcf) |
||||
| Region | 1/20/12
|
1/13/12
|
change |
|
| East | 1,571 |
1,693 |
-122
|
|
| West | 406 |
433 |
-27
|
|
| Producing | 1,121 |
1,164 |
-43
|
|
| Total | 3,098 |
3,290 |
-192
|
|
| Source: U.S. Energy Information Administration | ||||
| Working Gas in Underground Storage | |||||
|---|---|---|---|---|---|
Historical Comparisons |
|||||
Year ago (1/20/11) |
5-year average (2007-2011) |
||||
| Region | Stocks (Bcf) |
% change |
Stocks (Bcf) |
% change |
|
| East | 1,295 |
21.3 |
1,369 |
14.8 |
|
| West | 352 |
15.3 |
345 |
17.7 |
|
| Producing | 920 |
21.8 |
837 |
33.9 |
|
| Total | 2,567 |
20.7 |
2,551 |
21.4 |
|
| Source: U.S. Energy Information Administration | |||||
| Temperature -- Heating & Cooling Degree Days (week ending Jan 19) | ||||||||
|---|---|---|---|---|---|---|---|---|
HDD deviation from: |
CDD deviation from: |
|||||||
| Region | HDD Current |
normal |
last year |
CDD Current |
normal |
last year |
||
| New England | 261
|
-14
|
-39
|
0
|
0
|
0
|
||
| Middle Atlantic | 258
|
-4
|
-23
|
0
|
0
|
0
|
||
| E N Central | 285
|
-12
|
-19
|
0
|
0
|
0
|
||
| W N Central | 301
|
-17
|
-40
|
0
|
0
|
0
|
||
| South Atlantic | 180
|
-3
|
-26
|
2
|
-6
|
0
|
||
| E S Central | 178
|
-12
|
-34
|
0
|
-2
|
0
|
||
| W S Central | 111
|
-29
|
-34
|
2
|
-2
|
2
|
||
| Mountain | 213
|
-21
|
32
|
0
|
0
|
0
|
||
| Pacific | 132
|
11
|
65
|
0
|
-1
|
0
|
||
| United States | 217
|
-9
|
-7
|
1
|
-1
|
0
|
||
|
Note: HDD = heating degree-day; CDD = cooling degree-day Source: National Oceanic and Atmospheric Administration | ||||||||
| U.S. Natural Gas Supply - Gas Week: (1/18/12 - 1/25/12) | ||
|---|---|---|
Percent change for week compared with: |
||
last year |
last week |
|
| Gross Production | 7.37%
|
-0.25%
|
| Dry Production | 8.24%
|
-0.28%
|
| Canadian Imports | -31.18%
|
-4.43%
|
| West (Net) | -13.79%
|
-0.87%
|
| MidWest (Net) | -33.79%
|
1.12%
|
| Northeast (Net) | -42.94%
|
-11.84%
|
| LNG Imports | -31.82%
|
-3.18%
|
| Total Supply | 3.12%
|
-0.64%
|
| Source: BENTEK Energy LLC | ||
| U.S. Consumption - Gas Week: (1/18/12 - 1/25/12) | ||
|---|---|---|
Percent change for week compared with: |
||
last year |
last week |
|
| U.S. Consumption | -9.53%
|
-4.41%
|
| Power | 15.97%
|
-6.43%
|
| Industrial | -3.72%
|
-0.64%
|
| Residential/Commercial | -20.05%
|
-4.98%
|
| Total Demand | 14.23%
|
1.33%
|
| Source: BENTEK Energy LLC | ||
| Rigs | |||
|---|---|---|---|
Fri, January 20, 2012 |
Change from |
||
last week |
last year |
||
| Oil Rigs | 1,223 |
2.69% |
49.25% |
| Natural Gas Rigs | 780 |
-1.39% |
-12.69% |
| Miscellaneous | 5 |
0.00% |
-44.44% |
| Rig Numbers by Type | |||
|---|---|---|---|
Fri, January 20, 2012 |
Change from |
||
last week |
last year |
||
| Vertical | 619 |
0.98% |
19.26% |
| Horizontal | 1,183 |
1.89% |
20.19% |
| Directional | 206 |
-3.29% |
-8.58% |
| Source: Baker Hughes Inc. | |||