In the News:
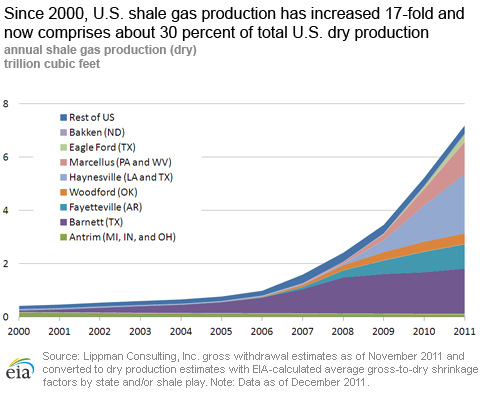
Natural Gas Futures Price Nears 10-Year Low
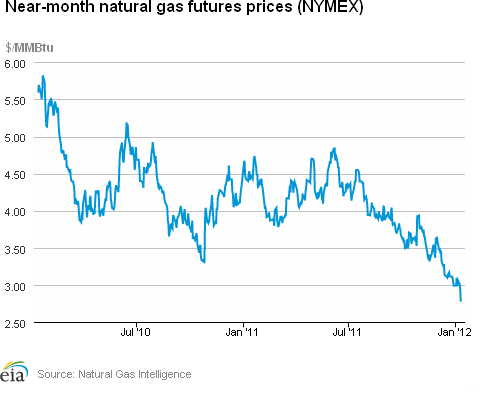
Natural gas prices on the New York Mercantile Exchange (NYMEX) settled at $2.488 per million British Thermal Units (MMBtu) on Tuesday, January 17. A near-month contract has not ended daily trading that low since March 5, 2002, nearly 10 years ago. Prices dropped again, slightly, the following day, settling at $2.472 per MMBtu on Wednesday. Near-month contract prices fell below $3 per MMBtu during August and September 2009, but recent drops are particularly notable because of the time of year. January is typically a month when natural gas prices are relatively high, the result of increased weather-related demand. Most analysts attribute the current price weakness to a winter that, so far, has been much warmer than normal, combined with abundant production and storage surpluses.
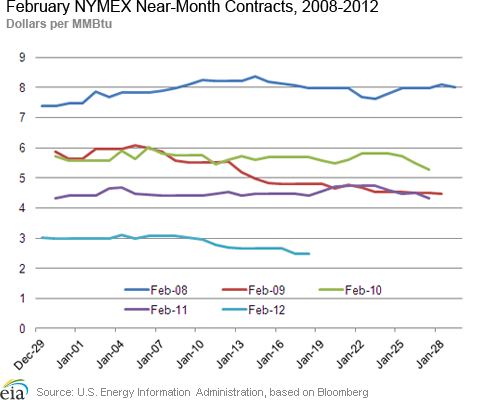
The February NYMEX natural gas contract, during its recent tenure as the near-month contract, has been significantly below February near-month contracts for the last several years (see figure). In addition to the warmer-than-normal winter, temperatures in the coming week are expected to be relatively mild, possibly contributing to further price declines.
Overview:
(For the Week Ending Wednesday, January 18, 2012)
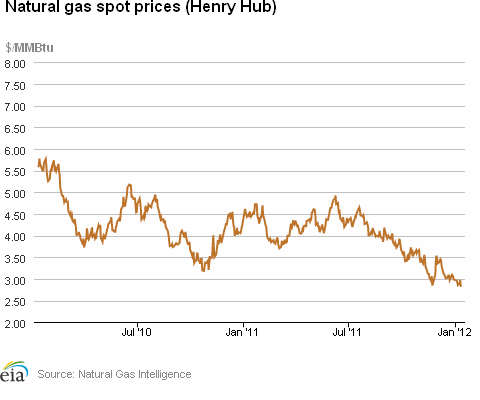
- Spot prices at most market locations fell during the report week (Wednesday, January 11 to Wednesday, January 18), the result of relatively mild weather in most of the country. The Henry Hub spot price fell 32 cents from $2.81 per MMBtu to $2.49 per MMBtu.
- Declines continued at the New York Mercantile Exchange, as the near-month contract hit lows not seen since 2002. The February 2012 contract fell from $2.774 per MMBtu last Wednesday to $2.472 yesterday.
- Working natural gas in storage fell slightly last week to 3,290 billion cubic feet (Bcf) as of Friday, January 13, according to the U.S. Energy Information Administration's (EIA) Weekly Natural Gas Storage Report (WNGSR). The implied net withdrawal for the week was 87 Bcf, positioning storage volumes 539 Bcf above year-ago levels.
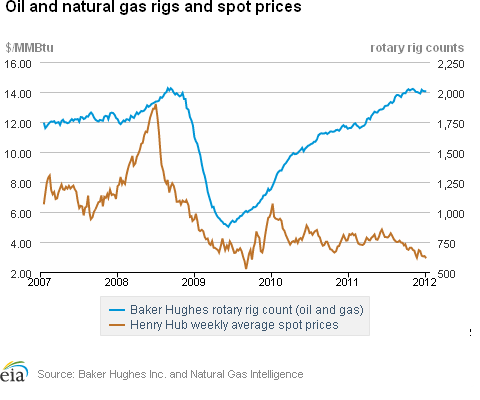
- The natural gas rotary rig count, as reported by Baker Hughes Incorporated on January 13, fell by 20 to 791.
Prices:
With few exceptions, natural gas prices dropped substantially at most market locations. The Henry Hub price continued declines from last week, falling 32 cents over the week to end yesterday at $2.49 per MMBtu. Most other pricing points that posted declines fell by similar amounts, in the 20 to 30 cents range. A relatively warm winter so far, as well as higher-than-average storage levels, has put downward pressure on natural gas prices this year.
One major exception to the general price declines this week was the Northeast. Price changes were somewhat mixed, with New England and New York posting relatively large gains and other points declining. Prices at the Algonquin Citygate (which serves Boston) rose on the week by $1.80 per MMBtu, to as high as $7.36 per MMBtu on Friday, January 13, heading into the long holiday weekend. At Transcontinental Pipeline's Zone 6 trading point for delivery into New York City, prices rose $2.04 per MMBtu on the week, from $3.17 per MMBtu last Wednesday to $5.21 per MMBtu yesterday. Price increases were likely related to cold weather expected for the end of the report week. Pipeline constraints in the Northeast can put upward pressure on prices, causing New York and New England prices to trade at a premium to the Henry Hub.
The Pacific Northwest was the other exception. Prices at the Northwest Sumas trading point, in Washington State, rose by 4 cents on the week from $3.14 to $3.18. The basis spread (the difference between a regional price and the benchmark Henry Hub) rose sharply this week as Sumas increased slightly and the Henry Hub price fell. Cold weather in the Pacific Northwest has likely driven the price increase. While Seattle has been receiving snow, neighboring British Columbia has also been experiencing frigid temperatures, leading to declines in Canadian exports to the West. According to data from BENTEK Energy LLC (Bentek), the West's imports from Canada fell by almost 11 percent on the week. Power burn in the region increased on the week by about 10 percent.
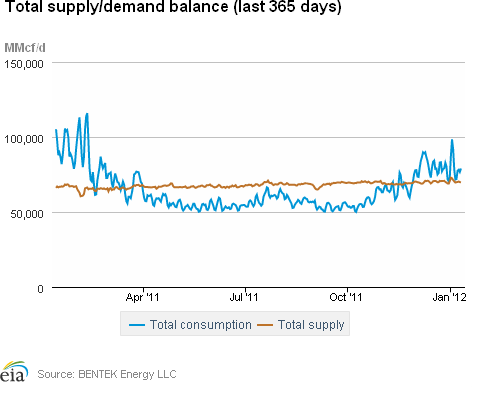
Both supply and consumption increased this week. Natural gas production remained flat, according to estimates from Bentek, yet remains well above year-ago levels. Overall, imports from Canada increased by about 6 percent, as imports to the Midwest and Northeast offset declines into the West. LNG sendout, while still at very low levels relative to last year, increased by about 7 percent. Total consumption increased by about 20 percent, with power burn and residential/commercial consumption showing the largest increases. These increases were likely weather-related, as consumers and businesses turned on the heat, using natural gas and electric power for space heating. Consumption increased over last year's levels, as the weather got colder, but still remains below average levels for the week. Residential and commercial consumption averaged 46.8 Bcf per day this week, compared with a 5-year (2007-2011) average of 49.5 Bcf per day.
At the NYMEX, prices dropped to lows not seen in almost 10 years. The near-month (February 2012) futures contract fell from $2.774 per MMBtu last Wednesday to $2.472 yesterday. The 12-month strip, the average of the 12 contracts between February 2012 and January 2013, declined from $3.114 per MMBtu last Wednesday to $2.848 per MMBtu yesterday.
Storage
Working natural gas in storage fell to 3,290 Bcf as of Friday, January 13, according to EIA's WNGSR. This represents an implied net withdrawal of 87 Bcf. Stocks were 566 Bcf higher than the 5-year average level, as well as 539 Bcf higher than last year at this time. Inventories in the Producing Region stand out at 276 Bcf (31.1 percent) above the 5-year average of 888 Bcf. Stocks in the East and West Regions were above their 5-year averages by 224 Bcf (15.2 percent) and 66 Bcf (18.0 percent), respectively.
The implied net withdrawal was 46% lower than the 5-year average withdrawal for the week, likely due to warmer-than-normal weather. In all three regions, the net withdrawals for the week were significantly lower than the 5-year average. The implied net withdrawal of 15 Bcf in the Producing region was 70% lower than the 5-year average. Implied net withdrawals in the East and West Regions were 33% and 48% lower than the 5-year average, respectively.
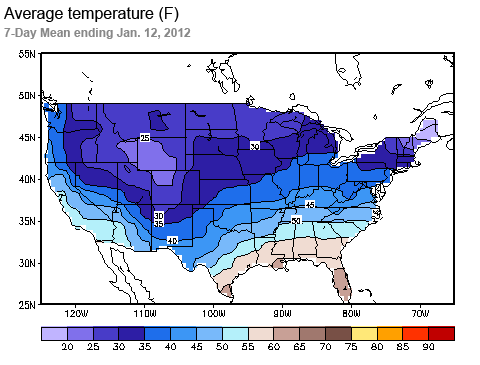
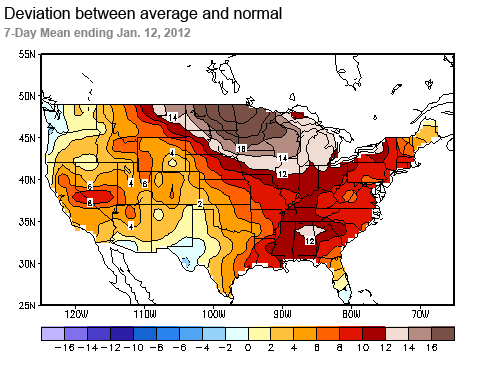
Temperatures during the week ending January 12 were 9.1 degrees warmer than the 30-year normal temperature and 13.1 degrees warmer than the same period last year. At the national level, the average temperature was higher than the 30-year average by a greater margin than the last 9 weeks of warmer-than-normal temperatures. During the week all regions were warmer than normal, particularly the West North Central and East North Central regions in the Midwest averaging 13.7 and 13.6 degrees warmer than normal, respectively. Heating degree-days nationwide were down 28.8 percent from normal.
See also:
| Spot Prices ($/MMBtu) | Thu, 12-Jan |
Fri, 13-Jan |
Mon, 16-Jan |
Tue, 17-Jan |
Wed, 18-Jan |
|---|---|---|---|---|---|
| Henry Hub | 2.70 |
2.67 |
0.00 |
2.51 |
2.49 |
| New York | 3.79 |
6.68 |
0.00 |
3.97 |
5.21 |
| Chicago | 2.87 |
2.79 |
0.00 |
2.66 |
2.69 |
| Cal. Comp. Avg,* | 2.99 |
2.96 |
0.00 |
2.88 |
2.79 |
| Futures ($/MMBtu) | |||||
| February delivery | 2.697 |
2.670 |
0.000 |
2.488 |
2.472 |
| March delivery | 2.737 |
2.713 |
0.000 |
2.528 |
2.516 |
| *Avg. of NGI's reported prices for: Malin, PG&E citygate, and Southern California Border Avg. | |||||
| Source: NGI's Daily Gas Price Index | |||||
| Working Gas in Underground Storage | ||||
|---|---|---|---|---|
Stocks billion cubic feet (bcf) |
||||
| Region | 1/13/12
|
1/6/12
|
change |
|
| East | 1,693 |
1,754 |
-61
|
|
| West | 433 |
444 |
-11
|
|
| Producing | 1,164 |
1,179 |
-15
|
|
| Total | 3,290 |
3,377 |
-87
|
|
| Source: U.S. Energy Information Administration | ||||
| Working Gas in Underground Storage | |||||
|---|---|---|---|---|---|
Historical Comparisons |
|||||
Year ago (1/13/11) |
5-year average (2006-2010) |
||||
| Region | Stocks (Bcf) |
% change |
Stocks (Bcf) |
% change |
|
| East | 1,402 |
20.8 |
1,469 |
15.2 |
|
| West | 368 |
17.7 |
367 |
18.0 |
|
| Producing | 981 |
18.7 |
888 |
31.1 |
|
| Total | 2,751 |
19.6 |
2,724 |
20.8 |
|
| Source: U.S. Energy Information Administration | |||||
| Temperature -- Heating & Cooling Degree Days (week ending Jan 12) | ||||||||
|---|---|---|---|---|---|---|---|---|
HDD deviation from: |
CDD deviation from: |
|||||||
| Region | HDD Current |
normal |
last year |
CDD Current |
normal |
last year |
||
| New England | 210
|
-62
|
-68
|
0
|
0
|
0
|
||
| Middle Atlantic | 191
|
-69
|
-96
|
0
|
0
|
0
|
||
| E N Central | 200
|
-95
|
-120
|
0
|
0
|
0
|
||
| W N Central | 222
|
-96
|
-117
|
0
|
0
|
0
|
||
| South Atlantic | 116
|
-66
|
-112
|
5
|
-3
|
3
|
||
| E S Central | 110
|
-79
|
-129
|
0
|
-2
|
0
|
||
| W S Central | 93
|
-48
|
-76
|
1
|
-2
|
1
|
||
| Mountain | 216
|
-20
|
-46
|
0
|
0
|
0
|
||
| Pacific | 96
|
-28
|
-44
|
0
|
0
|
0
|
||
| United States | 161
|
-65
|
-91
|
1
|
-1
|
1
|
||
|
Note: HDD = heating degree-day; CDD = cooling degree-day Source: National Oceanic and Atmospheric Administration | ||||||||
| U.S. Natural Gas Supply - Gas Week: (1/11/12 - 1/18/12) | ||
|---|---|---|
Percent change for week compared with: |
||
last year |
last week |
|
| Gross Production | 9.09%
|
-0.03%
|
| Dry Production | 10.17%
|
-0.04%
|
| Canadian Imports | -25.28%
|
6.23%
|
| West (Net) | -9.97%
|
-10.78%
|
| MidWest (Net) | -33.32%
|
6.14%
|
| Northeast (Net) | -31.99%
|
33.06%
|
| LNG Imports | -44.53%
|
7.22%
|
| Total Supply | 5.22%
|
0.50%
|
| Source: BENTEK Energy LLC | ||
| U.S. Consumption - Gas Week: (1/11/12 - 1/18/12) | ||
|---|---|---|
Percent change for week compared with: |
||
last year |
last week |
|
| U.S. Consumption | -1.74%
|
20.51%
|
| Power | 15.43%
|
17.94%
|
| Industrial | -1.45%
|
3.17%
|
| Residential/Commercial | -8.26%
|
31.27%
|
| Total Demand | 6.20%
|
10.63%
|
| Source: BENTEK Energy LLC | ||
| Rigs | |||
|---|---|---|---|
Fri, January 13, 2012 |
Change from |
||
last week |
last year |
||
| Oil Rigs | 1,191 |
0.00% |
50.95% |
| Natural Gas Rigs | 791 |
-2.47% |
-10.09% |
| Miscellaneous | 5 |
0.00% |
-44.44% |
| Rig Numbers by Type | |||
|---|---|---|---|
Fri, January 13, 2012 |
Change from |
||
last week |
last year |
||
| Vertical | 613 |
-2.85% |
22.76% |
| Horizontal | 1,161 |
0.09% |
19.96% |
| Directional | 213 |
-1.39% |
-1.37% |
| Source: Baker Hughes Inc. | |||