In the News:
Frigid Weather in the West Leads to Early Winter Production Freeze-Offs
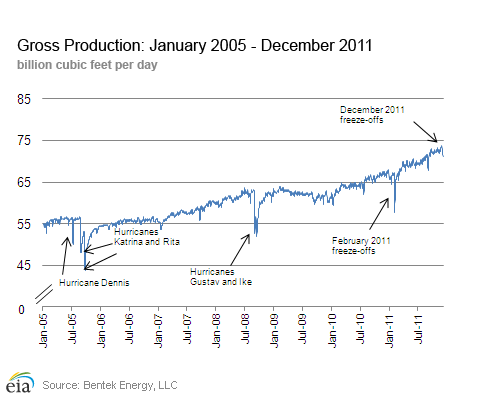
Early winter production freeze-offs (natural gas flow blockages resulting from water vapor freezing in the natural gas stream) this week have led producers in some western areas of the country to shut in natural gas wells, according to recent news reports and analysis from BENTEK Energy, LLC (Bentek). This early incident represented the first wide-spread test of freeze protection systems for this year's heating season. Total U.S. gross production was down 1.4 percent from the previous week.
This week's freeze-offs mainly occurred in the West, with San Juan basin production falling 400 million cubic feet (MMcf) on Monday before mostly recovering by yesterday. Stranded natural gas at a compressor station in the Rockies also contributed to production declines later in the week. These supply declines have occurred concurrently with increased demand for natural gas for both space heating in the residential and commercial sector, and demand for natural gas for electric power generation.
However, the production shortfalls this week were relatively minor compared to other major freeze-offs that have occurred in the past. Freeze-offs in February 2011, for example, created the biggest supply disruption since Hurricanes Gustav and Ike in 2008 (see figure for other major supply disruptions in the past 6 years) . Freeze-offs have become a larger issue over the past few years, especially as onshore production has made up an increasingly larger part of the natural gas supply mix.
Overview:
(For the Week Ending Wednesday, December 7, 2011)
- Net price changes this week were somewhat mixed, with most prices posting a net decline over the report week. The Henry Hub spot price fell 8 cents overall from $3.53 per million Btu (MMBtu) last Wednesday, November 30, to $3.45 per MMBtu yesterday, December 7.
- At the New York Mercantile Exchange, the near-month (January 2012) futures contract fell from $3.550 per MMBtu last Wednesday to $3.421 per MMBtu yesterday.
- Working natural gas in storage fell by 20 billion cubic feet (Bcf) for the week ending December 2, according to EIA's Weekly Natural Gas Storage Report (WNGSR).
- The natural gas rotary rig count, as reported by Baker Hughes Incorporated, fell by 9 this week to 856. This week marked the fifth consecutive week in which natural gas rigs have fallen.
Prices:
Despite forecasts for substantially colder temperatures near the end of the report week across most parts of the country, natural gas price changes at the end of the report week were still somewhat mixed. The Henry Hub price rose only 2 cents on the last day of the report week, from $3.43 per MMBtu on Tuesday to $3.45 per MMBtu yesterday.
Despite a relatively strong end-of-week rally, prices in the Northeast posted a net decline for the week. Forecasters warned that rain across the East Coast on Wednesday, December 7, could become snow, with storms hitting New England the hardest. At Transcontinental Pipeline's Zone 6 pricing point for delivery into New York City, the spot price began the report week at $4.11 per MMBtu last Wednesday, before dropping to an intra-week low of $3.64 per MMBtu on Friday. Colder weather in the region helped boost prices at Zone 6 to $3.94 per MMBtu yesterday. The largest end-of-week rallies were seen in New England, with prices at Dracut, Massachusetts, and the Algonquin Citygate (serving Boston) rising more than 30 cents yesterday.
Rockies prices also saw some gains near the end of the report week. From Tuesday to Wednesday the spot price at the Opal Hub rose 8 cents to $3.60 per MMbtu, and posted an overall gain for the week of 6 cents. Opal prices, usually somewhat below the Henry Hub prices, have risen above Henry Hub in the past several weeks. Outflows on the Rockies Express Pipeline are down more than 50 percent this month compared to December 2010, according to data from Bentek. Below-normal temperatures have led to high demand in the region, and in the past few days, an outage on a compressor station on Enterprise's Jonah Gathering System has curtailed Rockies production by about 0.5 Bcf per day.
Consumption of natural gas rose this week, in conjunction with reduced supply. Domestic consumption rose 18.4 percent, according to data released by Bentek, with larger gains near the end of the report week. The largest gains came from the residential and commercial sectors, as well as the electric power sector. Production fell on the week, as a result of early seasonal freeze-offs as well as maintenance issues affecting some Western pipeline infrastructure systems. Both LNG sendout and imports from Canada rose on the week to accommodate increased demand for heating.
At the New York Mercantile Exchange, the January 2012 futures contract fell from $3.550 per MMBtu last Wednesday to $3.421 per MMBtu yesterday. Futures prices are below their year-ago levels; as of December 7 last year, the January 2011 futures contract had ranged from $4.180 per MMBtu to $4.488 per MMBtu during its tenure as the near-month contract. This week, the 12-month strip (the average of the 12 contracts between January 2012 and December 2012) fell to $3.651 per MMBtu yesterday, from $3.754 per MMBtu last Wednesday.
Storage
Working natural gas in storage fell to 3,831 Bcf as of Friday, December 2, according to EIA's WNGSR. This represents an implied net withdrawal of 20 Bcf. The withdrawal was much smaller than both the 5-year average withdrawal of 66 Bcf and last year's 79 Bcf draw. Stocks are now 307 Bcf above the 5-year average and 102 Bcf above last year.
The West Region has not had a net withdrawal in the past three weeks. The previous week's withdrawal was confined to the East Region while the other two regions continued to add natural gas to storage. This week saw a modest withdrawal in the Producing Region of 5 Bcf, and another slightly larger draw in the East Region of 16 Bcf. All three regions remain well above average levels, but the Producing Region stands out at 169 Bcf (16 percent) above average. Some of the relatively small draw can be attributed to abnormally high temperatures in most of the country as well as high production during the storage report week.
Temperatures during the week ending December 1 were 5.1 degrees warmer than the 30-year normal temperature level and 6.6 degrees warmer than last year. In fact, temperatures were slightly warmer than the previous week. Every region of the country except the West South Central was warmer than normal. The Northeast was warmest relative to normal with New England 10.7 degrees above average and the Middle Atlantic 10.0 degrees above. Heating degree-days were down 22.2 percent from normal and 26.6 percent from last year.See also:

| Spot Prices ($/MMBtu) | Thu, 01-Dec |
Fri, 02-Dec |
Mon, 05-Dec |
Tue, 06-Dec |
Wed, 07-Dec |
|---|---|---|---|---|---|
| Henry Hub | 3.49 |
3.35 |
3.35 |
3.43 |
3.45 |
| New York | 3.93 |
3.64 |
3.73 |
3.89 |
3.94 |
| Chicago | 3.57 |
3.51 |
3.68 |
3.61 |
3.60 |
| Cal. Comp. Avg,* | 3.70 |
3.62 |
3.75 |
3.70 |
3.70 |
| Futures ($/MMBtu) | |||||
| January delivery | 3.648 |
3.584 |
3.461 |
3.487 |
3.421 |
| February delivery | 3.675 |
3.613 |
3.490 |
3.523 |
3.458 |
| *Avg. of NGI's reported avg. prices for: Malin, PG&E citygate, and Southern California Border Avg. | |||||
| Source: NGI's Daily Gas Price Index | |||||

| Working Gas in Underground Storage | ||||||||
|---|---|---|---|---|---|---|---|---|
Stocks billion cubic feet (bcf) |
Historical Comparisons |
|||||||
Year ago (12/8/10) |
5-year average (2006-2010) |
|||||||
| Region | 12/8/11
|
12/1/11
|
change |
Stocks (Bcf) |
% change |
Stocks (Bcf) |
% change |
|
| East | 2058
|
2074
|
-16
|
2009
|
2.4
|
1962
|
4.9
|
|
| West | 517
|
516
|
1
|
480
|
7.7
|
474
|
9.1
|
|
| Producing | 1256
|
1261
|
-5
|
1239
|
1.4
|
1087
|
15.5
|
|
| Total | 3831
|
3851
|
-20
|
3729
|
2.7
|
3524
|
8.7
|
|
| Source: U.S. Energy Information Administration | ||||||||
| Temperature -- Heating & Cooling Degree Days (as of Dec. 1) | ||||||||
|---|---|---|---|---|---|---|---|---|
HDD deviation from: |
CDD deviation from: |
|||||||
| Region | HDD Current |
normal |
last year |
CDD Current |
normal |
last year |
||
| New England | 119
|
-75
|
-77
|
0
|
0
|
0
|
||
| Middle Atlantic | 115
|
-70
|
-55
|
0
|
0
|
0
|
||
| E N Central | 166
|
-45
|
-51
|
0
|
0
|
0
|
||
| W N Central | 200
|
-38
|
-49
|
0
|
0
|
0
|
||
| South Atlantic | 97
|
-30
|
-21
|
8
|
-2
|
-5
|
||
| E S Central | 128
|
-3
|
-5
|
0
|
-1
|
-1
|
||
| W S Central | 103
|
8
|
-2
|
2
|
-2
|
-3
|
||
| Mountain | 173
|
-30
|
-75
|
0
|
0
|
0
|
||
| Pacific | 79
|
-26
|
-69
|
0
|
-1
|
0
|
||
| United States | 130
|
-36
|
-47
|
2
|
0
|
-1
|
||
|
Note: HDD = heating degree-day; CDD = cooling degree-day Source: National Oceanic and Atmospheric Administration | ||||||||

| U.S. Natural Gas Supply - Gas Week: (12/1/11 - 12/7/11) | ||
|---|---|---|
Percent change for week compared with: |
||
last year |
last week |
|
| Gross Production | 8.72%
|
-1.36%
|
| Dry Production | 8.51%
|
-1.33%
|
| Canadian Imports | -26.56%
|
19.35%
|
| West (Net) | -12.60%
|
11.54%
|
| MidWest (Net) | -29.99%
|
14.20%
|
| Northeast (Net) | -43.37%
|
53.71%
|
| LNG Imports | -35.87%
|
112.08%
|
| Total Supply | 4.02%
|
0.54%
|
| Source: BENTEK Energy LLC | ||
| U.S. Consumption - Gas Week: (12/1/11 - 12/7/11) | ||
|---|---|---|
Percent change for week compared with: |
||
last year |
last week |
|
| U.S. Consumption | -9.14%
|
18.36%
|
| Power | -1.46%
|
11.22%
|
| Industrial | -2.44%
|
2.46%
|
| Residential/Commercial | -15.48%
|
33.30%
|
| Total Demand | 3.35%
|
9.24%
|
| Source: BENTEK Energy LLC | ||

| Rigs | |||
|---|---|---|---|
Mon, December 05, 2011 |
Change from |
||
last week |
last year |
||
| Oil Rigs | 1132
|
0.18% |
52.29% |
| Natural Gas Rigs | 856
|
-1.04% |
-9.99% |
| Miscellaneous | 5
|
0.00% |
-50.00% |
| Rig Numbers by Type | |||
|---|---|---|---|
Mon, November 28, 2011 |
Change from |
||
last week |
last year |
||
| Vertical | 620
|
-1.90% |
19.47% |
| Horizontal | 1156
|
0.09% |
19.57% |
| Directional | 217
|
1.88% |
-2.29% |
| Source: Baker Hughes Inc. | |||