In the News:
Unseasonably Cold Weather in the Southeast Drives Up Natural Gas Demand
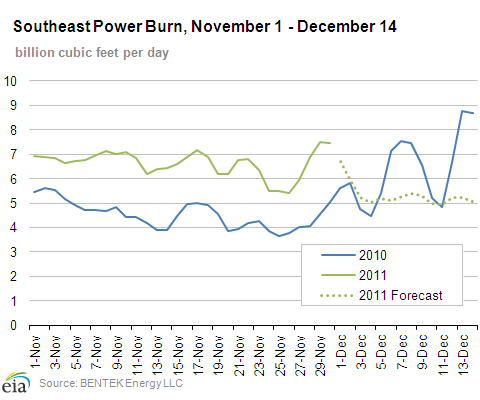
Many areas of the Southeastern United States experienced rare November snowfall and unseasonably cold weather earlier this week. Snow fell in parts of Missouri, Arkansas, Kentucky, Tennessee, and Alabama. The cold weather led to increases in natural gas consumption in the Southeast, particularly in the electric power and residential/commercial sectors, according to BENTEK Energy, LLC (Bentek). In the region, many homes are heated by natural-gas-generated electricity. In November, natural gas used for electric power generation remained well above year-ago levels in the Southeast, as colder temperatures throughout the month pushed up demand. Among some of the results of the recent cold weather:
- Total consumption in the Southeast spiked to 18.2 billion cubic feet (Bcf) on Wednesday, November 30, as temperatures were 10 degrees below normal. Total demand in the region was about 17 percent higher than November of the previous year.
- Bentek's reported power burn on Wednesday increased to 7.5 Bcf. Last November, power burn in the region averaged 4.5 Bcf per day (see graph). This November, power burn averaged 6.6 Bcf per day.
- Combined residential, commercial, and industrial use of natural gas also increased on Wednesday, rising 10.8 Bcf, compared to about 8.3 Bcf per day for the previous week.
- Temperatures are expected to warm up somewhat through the weekend, with demand dropping off somewhat.
Overview:
(For the Week Ending Wednesday, November 30, 2011)
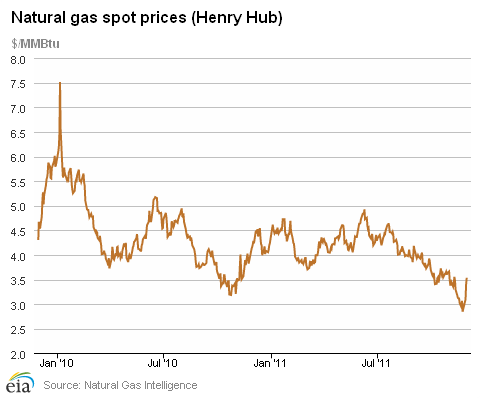
- Prices less than $3 per million Btu (MMBtu) just prior to the Thanksgiving holiday gave way to higher prices this week as temperatures turned from moderate to considerably colder.
- The Henry Hub price began the report week at $2.84 per MMBtu last Wednesday and subsequently climbed continuously, closing yesterday at $3.53 per MMBtu.
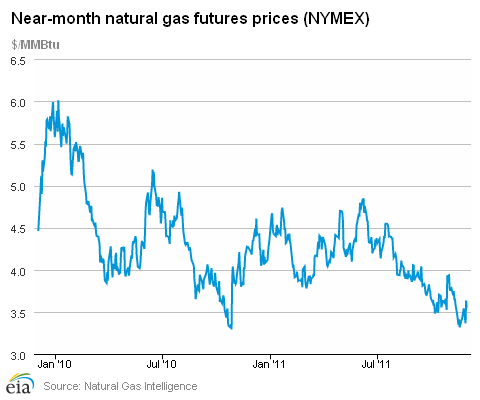
- At the New York Mercantile Exchange (NYMEX), the January 2012 natural gas contract closed the week down 5.8 cents at $3.550 per MMBtu.
- Working natural gas in storage fell from record levels to 3,851 Bcf as of Friday, November 25, according to the U.S. Energy Information Administration's (EIA) Weekly Natural Gas Storage Report (WNGSR). The implied decrease for the week was 1 Bcf, leaving storage volumes positioned 41 Bcf above year-ago levels.
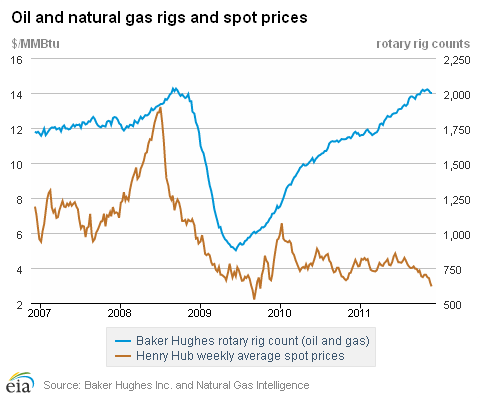
- The natural gas rotary rig count, as reported November 25 by Baker Hughes Incorporated, fell by 6 over the previous week to 865 active units. Meanwhile, oil-directed rigs increased by 5 to 1,130 units.
Prices:
Likely due to forecasts for moderate temperatures and expected reduced demand going into a holiday weekend, prices at most pricing locations across the country were below $3 per MMBtu the day prior to Thanksgiving. On Monday, November 21, the Henry Hub price closed at $2.94 per MMBtu, falling below $3.00 per MMBtu for the first time since November 16, 2009. By Wednesday, the day before Thanksgiving and the start of this report week, it had declined another 10 cents to close at $2.84 per MMBtu. Going into the holiday weekend most pricing points across the country were under $3.00 per MMBtu, and most prices along the Gulf Coast were under $2.80 per MMBtu. Mild holiday weekend temperatures were replaced with considerably cooler temperatures by the beginning of the week, and on Monday essentially all pricing points were back above $3.00 per MMBtu. Across the board increases continued as temperatures continued to drop, and most points closed yesterday above $3.50 per MMBtu. Prices over the report week at the Henry Hub increased from $2.84 to $3.53 per MMBtu. At the Transco Zone 6 pricing point for delivery into New York City, the price climbed from $2.99 to $4.11 per MMBtu. The Algonquin Citygate price (servicing Boston) posted a 20 percent increase, beginning the week at $3.72 per MMBtu and closing yesterday at $4.46 per MMBtu.
At the NYMEX, the January 2012 contract moved into the near-month position and oscillated over the report week from a high of $3.655 per MMBtu to a low of $3.525 per MMBtu, closing yesterday at $3.550 per MMBtu, down 5.8 cents (1.6 percent) from $3.608 per MMBtu last Wednesday. The December 2011 contract expired on Monday (November 28) at $3.364 per MMBtu. The 12-month strip remained relatively even over the week, beginning the week at $3.728 per MMBtu and closing the week yesterday at $3.754 per MMBtu.
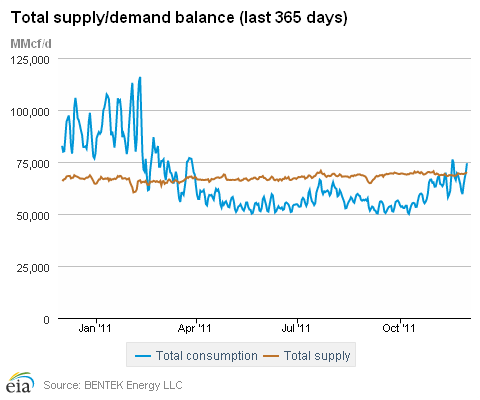
Although consumption over the Thanksgiving weekend remained relatively low, overall consumption showed considerable daily increases from Sunday through the remainder of the report week. Bentek reported the lowest consumption level for the week of 58 Bcf on Saturday, which was followed by average daily increases of over 15 percent beginning Sunday and continuing through the end of the report week (yesterday). Bentek reported yesterday's consumption at 73 Bcf, an increase of more than 25 percent over Saturday's low. The increases were primarily a result of high residential/commercial demand in the South due to unseasonable cold temperatures. In spite of the end-of-week increases, average overall domestic consumption for the week posted a 6 percent decrease over the previous report week. The declines were mostly in residential/commercial consumption, which saw a 7.2 percent drop, and in gas used for power generation, which posted a 10.3 percent decline.
In spite of average weekly declines in prices and demand, dry gas production increased over the report week by 1.2 percent and was 9.4 percent above year-ago volumes for the same week. According to Bentek estimates, daily production for the week was consistently near 65 Bcf. The 1.2 percent increase over the previous week was partly offset by declines in Canadian and LNG imports of 0.7 and 8.9 percent, respectively. Canadian and LNG imports are 17.6 and 51.9 percent respectively below year-ago volumes for the same week. Canadian imports averaged 4.4 Bcf per day over the week and LNG imports averaged 0.3 Bcf per day.
Storage
Working natural gas in storage fell to 3,851 Bcf as of Friday, November 25, according to EIA's WNGSR. This represents an implied net withdrawal of 1 Bcf, the first withdrawal of the 2011-2012 winter heating season. The withdrawal was considerably smaller than both the 5-year average withdrawal of 29 Bcf and last year's 21 Bcf draw. Stocks are now 261 Bcf and 41 Bcf above the 5-year average and last year, respectively.
The regional breakdown shows that the East Region was actually the only region with a net withdrawal during the week. This net withdrawal occurred despite relatively warm weather in the East Region during the week. The West and Producing Regions built by 2 Bcf and 14 Bcf, mostly offsetting the draw in the East Region. All three regions remain well above average levels, but the Producing Region stands out at 159 Bcf (14 percent) above average.
Temperatures during the week ending November 24 were 2.6 degrees warmer than the 30-year normal temperature level. Although the temperature fell 3.4 degrees from the previous week, every region of the country except the Pacific Region experienced warmer than normal weather. Nationwide, heating degree-days were down about 11 percent from normal and 4 percent from last year.
See also:
Spot Prices ($/MMBtu) |
Thu. 24-Nov |
Fri. 25-Nov |
Mon. 28-Nov |
Tue. 29-Nov |
Wed. 30-Nov |
|---|---|---|---|---|---|
| Henry Hub | Holiday |
Closed |
3.09 |
3.40 |
3.53 |
| New York | Holiday |
Closed |
3.30 |
3.71 |
4.11 |
| Chicago | Holiday |
Closed |
3.41 |
3.66 |
3.67 |
| Cal. Comp. Avg,* | Holiday |
Closed |
3.53 |
3.65 |
3.74 |
| Futures ($/MMBtu) | |||||
| December delivery | Holiday |
Closed |
3.364 |
expired |
expired |
| January delivery | Holiday |
Closed |
3.525 |
3.633 |
3.550 |
| February delivery | Holiday |
Closed |
3.555 |
3.653 |
3.578 |
| *Avg. of NGI's reported avg. prices for: Malin, PG&E citygate, and Southern California Border Avg. | |||||
| Source: NGI's Daily Gas Price Index | |||||
Spot Prices ($/MMBtu) |
Thu. 17-Nov |
Fri. 18-Nov |
Mon. 21-Nov |
Tue. 22-Nov |
Wed. 23-Nov |
|---|---|---|---|---|---|
| Henry Hub | 3.11 |
3.02 |
2.94
|
3.06 |
2.84 |
| New York | 3.59 |
3.30 |
3.24 |
3.33 |
2.99 |
| Chicago | 3.39 |
3.29 |
3.28 |
3.34 |
3.00 |
| Cal. Comp. Avg,* | 3.63 |
3.53 |
3.45 |
3.57 |
3.25
|
| Futures ($/MMBtu) | |||||
| December delivery | 3.410 |
3.316 |
3.399 |
3.415 |
3.460 |
| January delivery | 3.546 |
3.496 |
3.558 |
3.561 |
3.608 |
| *Avg. of NGI's reported avg. prices for: Malin, PG&E citygate, and Southern California Border Avg. | |||||
| Source: NGI's Daily Gas Price Index | |||||
| Working Gas in Underground Storage | ||||||||
|---|---|---|---|---|---|---|---|---|
Stocks billion cubic feet (bcf) |
Historical Comparisons |
|||||||
Year ago (11/25/10) |
5-year average (2006-2010) |
|||||||
| Region | 11/25/11
|
11/18/11
|
change |
Stocks (Bcf) |
% change |
Stocks (Bcf) |
% change |
|
| East | 2074
|
2091
|
-17
|
2055
|
0.9
|
2001
|
3.6
|
|
| West | 516
|
514
|
2
|
501
|
3
|
487
|
6
|
|
| Producing | 1261
|
1247
|
14
|
1253
|
0.6
|
1102
|
14.4
|
|
| Total | 3851
|
3852
|
-1
|
3810
|
1.1
|
3590
|
7.3
|
|
| Source: U.S. Energy Information Administration | ||||||||
| Temperature -- Heating & Cooling Degree Days (as of Nov. 24) | ||||||||
|---|---|---|---|---|---|---|---|---|
HDD deviation from: |
CDD deviation from: |
|||||||
| Region | HDD Current |
normal |
last year |
CDD Current |
normal |
last year |
||
| New England | 161
|
-15
|
1
|
0
|
0
|
0
|
||
| Middle Atlantic | 148
|
-20
|
6
|
0
|
0
|
0
|
||
| E N Central | 164
|
-28
|
-4
|
0
|
0
|
0
|
||
| W N Central | 194
|
-23
|
-22
|
0
|
0
|
0
|
||
| South Atlantic | 88
|
-26
|
-3
|
16
|
5
|
5
|
||
| E S Central | 81
|
-36
|
9
|
1
|
0
|
-1
|
||
| W S Central | 54
|
-29
|
9
|
12
|
7
|
-8
|
||
| Mountain | 162
|
-26
|
-28
|
0
|
0
|
0
|
||
| Pacific | 118
|
22
|
-15
|
0
|
-1
|
0
|
||
| United States | 134
|
-17
|
-6
|
4
|
1
|
0
|
||
|
Note: HDD = heating degree-day; CDD = cooling degree-day Source: National Oceanic and Atmospheric Administration | ||||||||
| U.S. Natural Gas Supply - Gas Week: (11/23/11 - 11/30/11) | ||
|---|---|---|
Percent change for week compared with: |
||
last year |
last week |
|
| Gross Production | 9.63%
|
1.22%
|
| Dry Production | 9.40%
|
1.19%
|
| Canadian Imports | -17.65%
|
-0.66%
|
| West (Net) | -19.38%
|
-1.67%
|
| MidWest (Net) | 18.57%
|
42.66%
|
| Northeast (Net) | -45.49%
|
-35.60%
|
| LNG Imports | -51.92%
|
-8.95%
|
| Total Supply | 6.52%
|
1.02%
|
| Source: BENTEK Energy LLC | ||
| U.S. Consumption - Gas Week: (11/23/11 - 11/30/11) | ||
|---|---|---|
Percent change for week compared with: |
||
last year |
last week |
|
| U.S. Consumption | -10.89%
|
-6.03%
|
| Power | 8.90%
|
-10.32%
|
| Industrial | -0.56%
|
-0.12%
|
| Residential/Commercial | -24.44%
|
-7.18%
|
| Total Demand | 1.17%
|
0.78%
|
| Source: BENTEK Energy LLC | ||
| Rigs | |||
|---|---|---|---|
Wed, November 23, 2011 |
Change from |
||
last week |
last year |
||
| Oil Rigs | 1130
|
0.44% |
55.39% |
| Natural Gas Rigs | 865
|
-0.69% |
-8.60% |
| Miscellaneous | 5
|
0.00% |
-50.00% |
| Rig Numbers by Type | |||
|---|---|---|---|
Fri, November 18, 2011 |
Change from |
||
last week |
last year |
||
| Vertical | 632
|
-1.40% |
22.56% |
| Horizontal | 1155
|
0.70% |
20.99% |
| Directional | 213
|
0.00% |
-1.39% |
| Source: Baker Hughes Inc. | |||