2010 Overview
Net imports of natural gas into the United States fell 3 percent to 2.6 trillion cubic feet (Tcf) during 2010. Continued growth in natural gas exports from the United States and falling imports of natural gas to the United States during 2010 accounted for the decline in net imports, which fell despite a 6-percent growth in domestic natural gas consumption during the year.
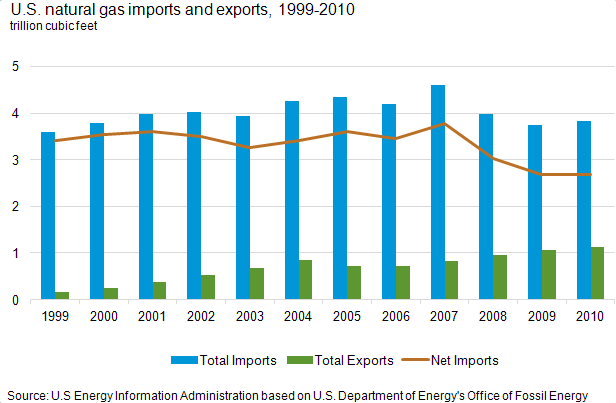 figure data
Domestic natural gas production was a primary driver in the declining level of net imports, as dry natural gas production in the United States increased 5 percent to 21.6 Tcf during 2010. With dry gas production at its highest level since 1973, increased domestic sources of natural gas helped maintain competitive prices and discouraged imports while encouraging exports.
2010 Highlights
Imports
Gross imports of natural gas declined somewhat during 2010 as falling LNG imports into the United States more than offset modest increases in pipeline imports. In 2010, the United States imported 3,741 billion cubic feet (Bcf) of natural gas, the lowest level since 1999, and the fourth consecutive year that natural gas imports to the United States declined.
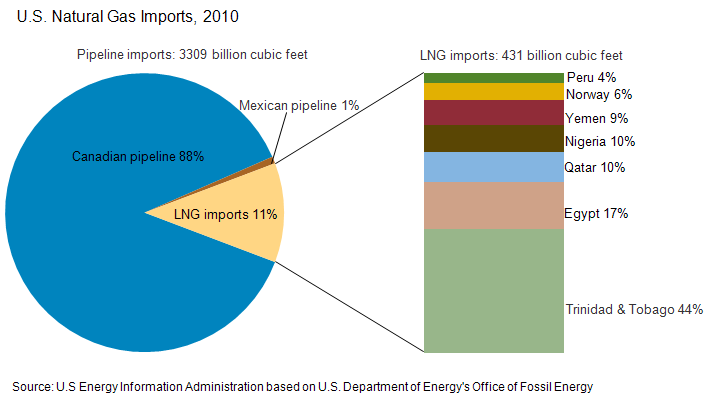 figure data
- Pipeline imports from Canada and Mexico totaled 3,309 Bcf, increasing about 10 Bcf during 2010. Canadian imports accounted for 88 percent of total imports.
- Total LNG imports declined about 21 Bcf, or about 5 percent, to 431 Bcf during 2010. LNG made up only 11 percent of U.S. total imports.
- Falling LNG imports from Egypt and Trinidad and Tobago accounted for most of the decline in LNG imports during 2010, while increased imports from Qatar, Nigeria, and first-time shipments from Yemen and Peru partially offset the declines.
Exports
Natural gas exports from the United States totaled 1,137 Bcf, increasing about 64 Bcf, or about 6 percent, during 2010. Pipeline exports accounted for 33 Bcf of the increase in exports from the United States during 2010 and LNG exports accounted for remainder.
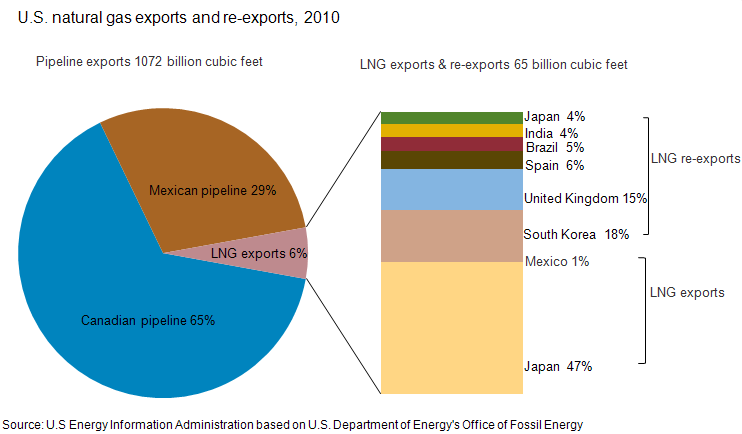 figure data
The growth in LNG exports in 2010 was driven by re-exports of LNG from the United States. Re-exports are shipments to foreign countries of LNG that were previously imported, offloaded into above-ground LNG storage tanks, and then subsequently reloaded onto tankers for delivery to other countries.
- Pipeline exports continued to account for 94 percent of total exports, with 65 percent of exports going to Canada.
- LNG exports to Japan totaled 33 Bcf during 2010. Most LNG exports, about 30 Bcf, originated from the Kenai LNG facility in Alaska for delivery to Japan. The rest of the LNG shipments to Japan during 2010 were re-exports from the Freeport LNG Terminal in Texas. (In 2011, ConocoPhillips and Marathon Oil announced plans to suspend operations at their LNG plant on the Kenai Peninsula in Alaska. At its peak, the facility annually shipped about 66 Bcf of LNG to Japan.)
- Re-exports of LNG totaled about 34 Bcf, more than half of LNG exports in 2010. Since it first occurred in 2009, re-exportation grew rapidly in 2010, with shipments going to Brazil, India, Spain, Japan, and the United Kingdom. Re-exports to South Korea and the United Kingdom comprised 62 percent of LNG re-exports in 2010.
- Currently, Freeport in Texas, and Sabine Pass and Cameron in Louisiana are the only terminals authorized to re-export LNG to foreign countries.