 View the dashboard ›

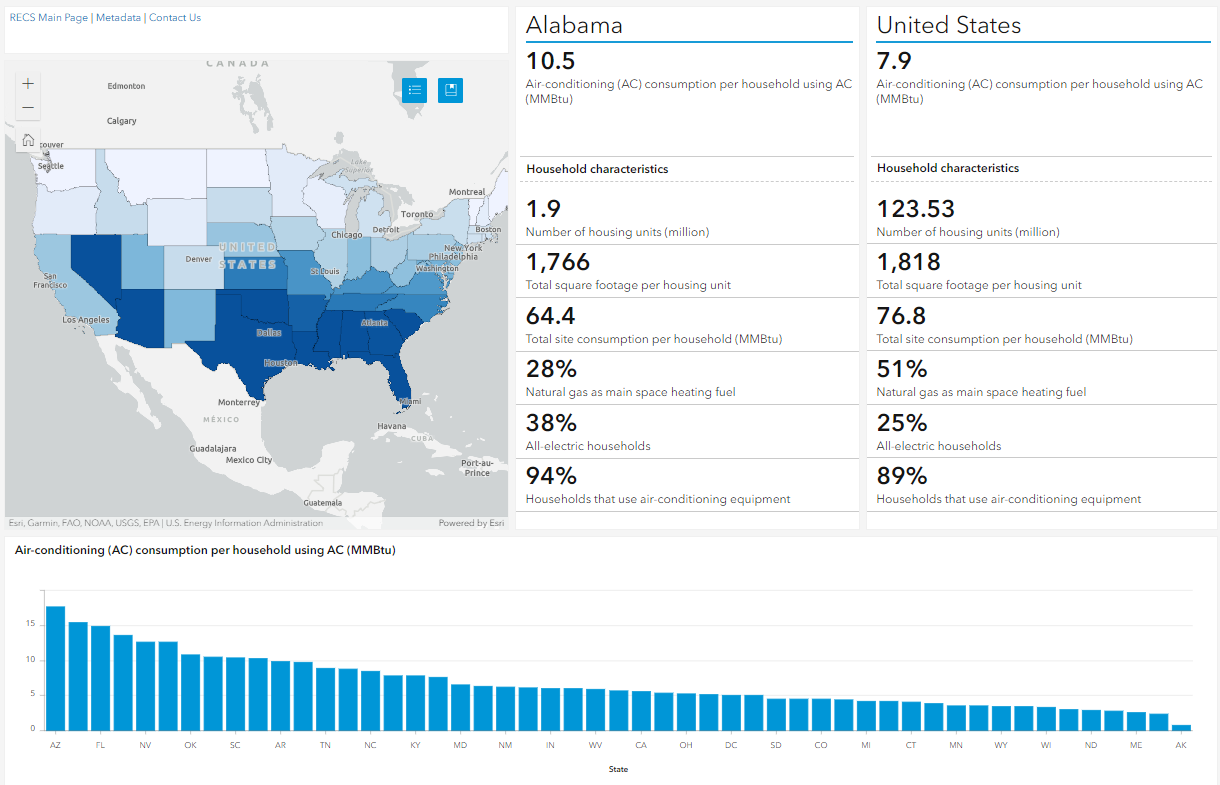
EIA household energy use data now includes detail on 16 States
RECS 2009 — Release date: March 28, 2011
EIA is releasing new benchmark estimates for home energy use for the year 2009 that include detailed data for 16 States, 12 more than in past EIA residential energy surveys. EIA has conducted the Residential Energy Consumption Survey (RECS) since 1978 to provide data on home energy characteristics, end uses of energy, and expenses for the four Census Regions and nine Divisions. In 1997, EIA produced additional tabulations for the four most populous States (California, New York, Texas, and Florida). A threefold increase in the number of households included in the 2009 RECS offers more accuracy and coverage for understanding energy usage for all estimated States, Regions and Divisions.
State-specific home energy use statistics cover two-thirds of U.S. households
The 16 States detailed in the 2009 RECS vary in their geography, climate, and population size. Together, they cover 63 percent of all homes occupied as a primary residence in the United States and 64 percent of the population.

Since 1978, EIA has provided household energy use statistics
for all Census Regions and Divisions through the Residential
Energy Consumption Survey
Each Census Region and Division contains at least one State for which EIA will produce new energy usage statistics. Although estimates of household energy uses cannot be produced for all of the 50 States, the larger sample size allows EIA to provide accurate estimates for groups of States beyond the 16 States. For example, separate energy usage statistics will be presented for "Mountain North" (CO, ID, MT, UT, and WY) and "Mountain South" (AZ, NM, and NV) subdivisions within the Mountain Division data tables.
The 16 States detailed in the 2009 RECS account for 65 percent of total household energy consumption in 2005, 63 percent of electricity consumption, 68 percent of natural gas consumption, 71 percent of fuel oil consumption, and 48 percent of propane (LPG) consumption. The four states broken out in the last RECS survey in 2005 accounted for only 18 to 30 percent of the consumption of these fuels.
Larger RECS reveals notable differences between States
The expanded State data series allows more accurate cross-State comparisons of key energy characteristics that affect home energy use.
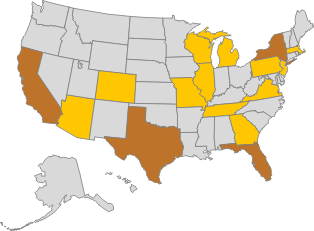
EIA publishes home energy data for 12 new States (indicated in
yellow), in addition to the previously covered 4 most populous
States (in brown).
- Almost half (48 percent) of households in Wisconsin use separate freezers, but only 14 percent of households in Massachusetts do the same.
- Twelve percent of households in Tennessee use front-loading clothes washers in their home, half as many households as in neighboring Virginia (24 percent). Front-loading clothes washers use much less water and energy than traditional, top-loading models.
The larger RECS allows more detailed analyses of energy use in homes today
The larger sample size for the 2009 RECS enables EIA to describe home energy use for more subgroups, more accurately than ever before. Future releases of data from the 2009 RECS will include end-use specific consumption and expenditures tabulated by State, in addition to Census Regions and Divisions, climate regions, housing unit type, and other characteristics.
| 2009 Occupied Housing Units (in millions |
Sample Size (in households) |
|||
|---|---|---|---|---|
| 2005 RECS | 2009 RECS | |||
| 4 Most Populous States | California | 12.2 | 468 | 1,606 |
| Texas | 8.5 | 267 | 991 | |
| New York | 7.2 | 251 | 839 | |
| Florida | 7.0 | 186 | 948 | |
| 12 New States | Pennsylvania | 4.9 | 196 | 285 |
| Illinois | 4.8 | 146 | 248 | |
| Michigan | 3.8 | 63 | 274 | |
| Georgia | 3.5 | 164 | 440 | |
| New Jersey | 3.2 | 126 | 204 | |
| Virginia | 3.0 | 55 | 281 | |
| Massachusetts | 2.5 | 250 | 501 | |
| Tennessee | 2.4 | 123 | 249 | |
| Arizona | 2.3 | 75 | 226 | |
| Missouri | 2.3 | 150 | 686 | |
| Wisconsin | 2.3 | 158 | 242 | |
| Colorado | 1.9 | 95 | 295 | |
| Other States | 41.9 | 1,609 | 3,768 | |
| All States | 113.6 | 4,382 | 12,083 | |