
Winter Energy Savings from Lower Thermostat Settings
Release Date: December 12, 2000
Introduction
Households that lower their thermostats by 1 degree Fahrenheit (1° F) during the current winter heating season may realize average savings of $15 to $40 or more, relative to annual heating bills that total a few hundred dollars to a thousand dollars or more. Potential savings are based on an examination of data from the 1997 Residential Energy Consumption Survey (RECS) and the Short-Term Energy Outlook (STEO), both products of the Energy Information Administration (EIA). Actual savings for individual households depend on the type of main heating fuel and the amount of fuel used, which, in turn, depend on home size, amount of insulation, area of the country, and many other variables.
The discussion that follows provides detail on the effect of lowering thermostat settings during the winter heating months of 1997. Persons interested in applying this information to the current heating season are advised to take into account the issues discussed in Methodology.
Assessment Based on 1997 RECS and STEO
Energy consumption and expenditures data from the 1997 RECS can be used to estimate the amount of energy used and energy costs that an average household would have saved in 1997 by lowering its thermostat(s) by 1° F during the winter heating months. Because RECS data are available only for calendar year 1997, the first and fourth quarter prices for 1997 are used as a proxy for the winter.
These cost savings from lowering the thermostat are compared to what would have occurred in 1997 if projected energy prices for the 2000-2001 heating season had been in effect. The adjusted savings are estimated using the February 2001 fuel price projections from the STEO.
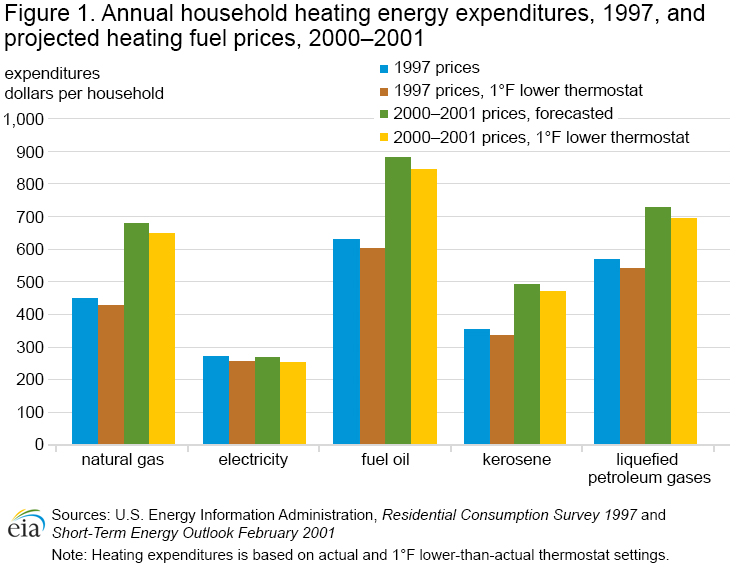
Figure 1 below shows estimated expenditures per household for each of the major U.S. heating fuels. Four different expenditures are shown for each fuel with the expenditures based on: (1) 1997 prices with no thermostat reduction; (2) 1997 prices with 1° F lower thermostat settings; (3) projected 2000-2001 prices with no thermostat reduction; and (4) projected 2000-2001 prices with 1° F lower thermostat settings. The percentage and dollar cost savings for each fuel are discussed below.
-
Natural Gas. Households whose main space-heating fuel was natural gas would have consumed 5 percent less natural gas for space heating and would have spent $22 less (for the entire year of 1997) if they had set their thermostat 1° F lower. The savings would have been $33 if the higher natural gas prices projected for the 2000-2001 heating season had been in effect.
-
Electricity. For households whose main space-heating energy source was electricity, the energy savings would have been 6 percent and the estimated savings for 1997 would have been $16. Because electricity prices have remained stable since 1997, the estimated savings using projected 2000-2001 prices would have been $16.
-
Fuel Oil. For households whose main space-heating fuel was fuel oil, the energy savings would have been 4 percent and the estimated savings for 1997 would have been $28. The estimated savings using projected 2000-2001 prices would have been $39.
-
Kerosene. For households whose main space-heating fuel was kerosene, the energy savings would have been 5 percent and the estimated savings for 1997 would have been $16. The estimated savings using projected 2000-2001 prices would have been $23.
-
Liquefied Petroleum Gases (LPG). For households whose main space-heating fuel was LPG, the energy savings would have been 5 percent and the estimated savings for 1997 would have been $27. The estimated savings using projected 2000-2001 prices would have been $35.
Climate Effects on Winter Energy Savings
The estimated savings shown above are for all households nationwide. As would be expected, the savings vary according to the climate in the Census Region or Division (Tables 1 through 4).
The variation can be explained by considering the borderline temperature—the threshold temperature below which space-heating equipment is used. When the temperature is above the borderline, the equipment is not used. Lowering the thermostat lowers the borderline temperature; hence, lowering the thermostat decreases the number of days when the heating equipment is used (see Methodology for further discussion).
The total number of days per year when it is necessary to heat homes is lower in a warmer climate than in a colder one. Therefore, decreasing the number of days when the equipment is used results in a bigger percentage drop in energy used for space heating in a warmer climate than in a colder one. Consequently, the percent savings are larger in warmer climates. For example, among households where the main space-heating fuel is natural gas, the estimated savings are 4 percent in the New England Census Division and 6 percent in the South Atlantic Census Division.
The climate effect also explains why the national estimated percent savings are higher for electricity than for the other fuels. In the warmer (southern) Census Divisions, where percentage savings are greater, the share of households that used electricity as their main space-heating energy source is greater than in the colder (northern) Census Divisions. By the same token, the aggregate cost savings for electricity are lower than for other fuels because electric space heating is concentrated in the South, which has much lower heating bills.
Contact
Specific questions on this product may be directed to Chip Berry.