Analysis of Energy Efficiency Program Impacts Based on Program Spending
Release date: May 21, 2015
Analysis of Energy Efficiency Program Impacts Based on Program Spending
The growth of energy efficiency (EE) programs at utility and state levels affects energy consumption in sectors targeted by such programs. Program spending effects are not uniform in terms of timing, investment trends, affected end uses, customer types and context (specific historical, market, policy and other relevant factors). Improved understanding of the effects of EE programs can improve baseline energy demand projections and enable enriched policy and scenario analysis related to programs that encourage or mandate increased EE program activity.
To gain insight into recent EE program activity and related implications for energy consumption, EIA contracted with Leidos Engineering, LLC (Leidos), previously known as Science Applications International Corporation (SAIC) to conduct research on regional differences in energy efficiency programs and spending. The contracted research report is included as Appendix A. The scope of the project was to characterize EE spending related to residential and commercial energy use for each of the nine Census divisions (see map)—the level of geographic detail used by the Residential Demand Module and Commercial Demand Module of the National Energy Modeling System (NEMS). Leidos research focused on rebate programs used by utilities as incentives for customers to purchase higher-efficiency products.
The report submitted by Leidos characterizes EE program spending at the end-use level. This information will be used by EIA as an input to the development of modeling assumptions for projections related to incremental EE programs in NEMS. Specifically, these inputs will be used to develop program spending allocations ('model portfolios') at the regional level in the NEMS building modules for lighting, heating, air conditioning, water heating, ventilation, refrigeration, and other end uses. The results, including regional variation in spending and efficiency gains, will support EIA's updates of the analytical and modeling assumptions in NEMS.
In selecting representative utilities for analysis, Leidos sorted utilities into five program categories across all Census divisions, based on their 2012 reporting of EE programs and spending on EIA Form EIA-861, Annual Electric Power Industry Report, which collects information on the status of electric power industry participants involved in the generation, transmission, distribution, and sale of electric energy in the United States, its territories, and Puerto Rico. In addition to three categories based on program spending levels (high, medium, and low) there was a per customer category for residential programs, and a per megawatt-hour category for commercial programs.1
Leidos examined EE program reports filed with state public utility commissions by selected utilities to characterize spending by end-use. In many instances programs can be divided into two groups based on their end-use emphasis: programs that are narrowly focused on lighting and heating, ventilation and air conditioning (HVAC) or broader programs that direct efficiency funds and services to a wider range of end-uses, technologies, and customers. The more investment a given state or provider makes in energy efficiency, the more likely they are to design and implement a broader program. In part this is because the initial end-use areas, although cost-effective, become saturated and this requires a broader effort if further energy savings are to be achieved.
In addition to supporting EIA's own efforts to enhance NEMS, the information in the Leidos report, including regional variation in spending and efficiency gains, will complement other research that seeks to provide greater public information and analysis about EE program spending and efficiency outcomes. This is important given the growing use of energy efficiency programs, with close to 30 states already having adopted EE goals or demand reduction targets.2 EE programs are also a potential strategy available to states under EPA's proposed Clean Power Plan rule under Section 111(d) of the Clean Air Act.
Figure 1. Map of U.S. Census Regions and Divisions3
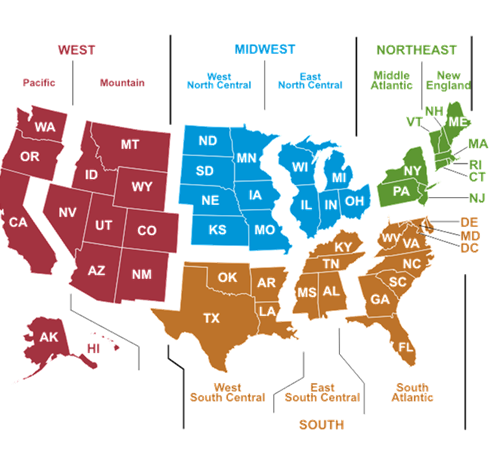
Source: U.S. Energy Information Administration.
When referencing the contract report in Appendix A, it should be cited as a report by Leidos Engineering, LLC prepared for the U.S. Energy Information Administration.
Footnotes
1Two additional categories relate to the way data are reported by certain entities that provide electric service and/or efficiency program services. If an entity reported EE program spending but no electricity sales, Leidos put them in a "no sales" category; if they reported electricity sales but no program spending, they were put in a "no spend" category.
2Analysis by U.S. Energy Information Administration using data in: American Council for an Energy Efficient Economy (ACEEE), State Energy Efficiency Resources Standards (EERS) (April 2015), accessed May 15, 2015; ACEEE, State and Local Policy Database, accessed May 15, 2015; Database of State Incentives for Renewables and Efficiency (DSIRE); and state public utility commission (PUC) websites.
3The Leidos report in Appendix A also refers to the Census divisions by number in the following order: 1. New England, 2. Middle Atlantic, 3. East North Central, 4. West North Central, 5. South Atlantic, 6. East South Central, 7. West South Central, 8. Mountain, 9. Pacific.