Federal Financial Interventions and Subsidies in Energy in Fiscal Years 2016–2022
Release date: August 1, 2023
Overview and Key Findings
Overview
Our report on direct federal financial interventions and subsidies in energy markets continues a series of EIA reports1 that respond to congressional requests and the Energy Policy Act of 1992. In this update, we introduce multiple, sequential fiscal year2 (FY) data for the first time from FY 2016 (the last fiscal year we analyzed) through FY 2022. To accommodate the increase in reported data, we reformatted and reorganized this update.
The scope of this report is limited to direct federal financial interventions and subsidies (that is, subsidies from the federal government that provide a financial benefit with an identifiable federal budget impact and that are specifically targeted at energy markets). We have excluded state and local programs—although significant in several cases—from our reporting. As a result of this exclusion and other exclusions, this report does not encompass all subsidies that affect energy markets and should, therefore, be viewed in context and with related information from other sources.
Consistent with our independent role and mission, this report informs discussion rather than draws conclusions or addresses policy issues related to energy subsidies. By using comprehensive data acquisition and analysis, we estimate how federal financial actions are distributed among a defined set of 14 energy types3 that make up the U.S. energy system. We have made only limited observations of the scale, trends, and relationships within the data and the report tables. In this report, we focus only on expenditures on subsidies, and we do not attempt to quantify the impact or evaluate the value of these subsidies. So, readers should exercise caution in drawing conclusions. Select Energy Subsidy Studies section in Appendix C notes related studies from other sources; we do not endorse other parties’ reports and include them for reference only.
Federal financial interventions and subsidies included in this report fall into four categories:
- Tax expenditure estimates, which measure the effects in federal government revenue resulting from preferential tax treatment for particular taxpayers
- Direct expenditures to non-federal recipients (that is, both energy producers and consumers) in the form of a grant, loan, or other financial assistance award
- Research and development (R&D) support in the form of a grant, loan, or other financial assistance award made to non-federal recipients.4
- Loan guarantees (a form of credit subsidy) that provide financial support for innovative clean energy technologies that typically do not qualify for conventional private financing because of their high technology risks5
Organization of this report
This overview and key findings section is followed by three appendices:
- Appendix A presents detailed tables
- Appendix B presents our analytic approach
- Appendix C provides a listing of select other subsidy reports
Detailed tables are included in Appendix A and are denoted with an “A” in the numbering scheme. Table A1 summarizes total within-scope energy subsidies (in 2022 dollars) and selected U.S. energy system indicators (in physical units). Table A3 summarizes the allocation of federal direct financial interventions in U.S. energy markets by year and energy type, and it serves as the basis for Figures 1-7. Overall, Appendix A (Tables A1–A7) provide critical details regarding energy subsidy expenditures.
Key findings
Several key findings stand out.
Beginning in FY 2016, tax expenditures rose rapidly and leveled off, but direct federal support remained steady until Congress recently enacted temporary provisions. Federal activities within the scope of this study were decreasing through FY 2016, because the provisions and programs under the American Reinvestment and Recovery Act (ARRA) of 2009 expired, after which direct expenditures remained relatively steady through FY 2020. Budgetary and statutory actions in response to the COVID-19 pandemic and related economic effects have resulted in a sharp but temporary rise in federal direct expenditures on energy in FY 2020 and FY 2021. Meanwhile, tax expenditures steadily increased from FY 2017 to FY 2020 and have since been slightly decreasing (Figure 1).
Figure 1. Energy-specific subsidies and support, FY 2016–22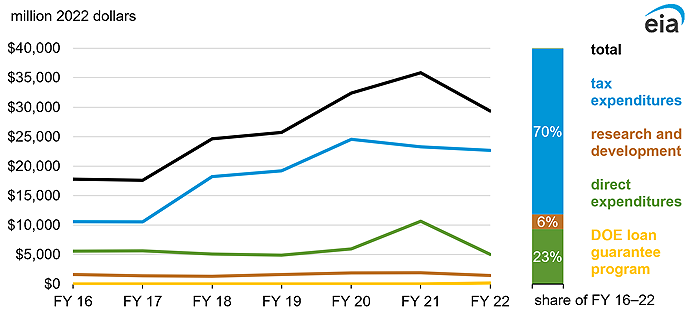
Data source: U.S. Energy Information Administration, Federal Financial Interventions and Subsidies in Energy in Fiscal Years 2016–2022, Table 1 and Table A3
Note: DOE=U.S. Department of Energy.
The U.S. energy system has continued to grow, except in FY 2020, when total energy use fell by a record 7% (Table A1). As a result, the relative scale of federal financial interventions into U.S. energy markets varied during FY 2016–22 as both federal energy-directed activities and the economy underwent historic volatility.
During FY 2016–22, most federal subsidies were for renewable energy producers (primarily biofuels, wind, and solar), low-income households, and energy-efficiency improvements. During FY 2016–22, nearly half (46%) of federal energy subsidies were associated with renewable energy, and 35% were associated with energy end uses. Federal support for renewable energy of all types more than doubled, from $7.4 billion in FY 2016 to $15.6 billion in FY 2022. Table A4 shows a more detailed distribution of renewable energy-related federal support, which is further discussed in the Renewable-related subsidy trends section of this Overview. Combined conservation and end-use subsidies increased from $9.0 billion in FY 2016 to $10.1 billion in FY 2022 (Table A3). The largest program of this combined category—the Low Income Home Energy Assistance Program (LIHEAP), administered through the U.S. Department of Health and Human Services (HHS)—slightly decreased its funding from $4.0 billion in FY 2016 to $3.9 billion in FY 2022, with a noteworthy one-year increase to nearly $10.0 billion in FY 2021 (Table A6).6
During FY 2016–22, provisions in the tax code were the largest source of federal financial support. In FY 2016, the Internal Revenue Code (IRC)—with its 31 wide-ranging, energy-specific tax provisions—provided greater financial support to energy than direct expenditures, including R&D expenditures (Table A2 and Table A3). Total tax expenditures were 70% of the total federal financial support (Table 1). Since FY 2016, tax expenditures have continued to grow, rising to over 75% of total federal support in recent years. In FY 2021, this support dipped slightly to 65%.
million 2022 dollars |
||||||
| Fiscal year | Direct expenditures | Tax expenditures | Research and Development | DOE Loan Guarantee Program | Total | Annual share of FY 2016–22 |
|---|---|---|---|---|---|---|
| 2016 | 5,559 | 10,586 | 1,640 | - | 17,785 | 10% |
| 2017 | 5,629 | 10,555 | 1,406 | - | 17,589 | 10% |
| 2018 | 5,086 | 18,234 | 1,326 | - | 24,646 | 13% |
| 2019 | 4,923 | 19,217 | 1,602 | - | 25,742 | 14% |
| 2020 | 5,938 | 24,572 | 1,861 | - | 32,370 | 18% |
| 2021 | 10,658 | 23,255 | 1,900 | - | 35,813 | 20% |
| 2022 | 5,054 | 22,682 | 1,461 | 166 | 29,363 | 16% |
| Total | 42,847 | 129,099 | 11,197 | 166 | 183,309 | 100% |
| Share of total | 23% | 70% | 6% | 0% | 100% | |
Data source: U.S. Energy Information Administration, Federal Financial Interventions and Subsidies in Energy in Fiscal Years 2016–2022, Table A3 Notes: Totals may not equal sum due to independent rounding. 0 estimate rounds to zero; - estimate is zero. DOE=U.S. Department of Energy. |
||||||
Natural gas and petroleum-related subsidies became a net cost to the federal government. Natural gas and petroleum-related tax expenditures increased to $2.1 billion in FY 2022 to reverse a trend from an estimated revenue inflow (versus a positive tax expenditure) of $1.1 billion in FY 2016 and FY 2017; combined, these tax provisions had been, in aggregate, the largest energy-related, revenue-generating tax provisions to the government in any of the fiscal years covered in this report (Table A5).
U.S. Department of Energy (DOE) loan guarantees were once again issued in FY 2022.7 The subsidy cost of the loans issued in FY 2022 was $166 million. Because this type of cost is assessed at the time the loan is issued, we did not identify any subsidy costs for FY 2016–21; for example, the loan guarantees associated with the Vogtle nuclear project were included with FY 2010 subsidy costs in our previous report updates. Although lending authority for the Section 1705 loan program expired by FY 2016, budget authority remains for future lending on the Section 1703 loan program.
Footnotes
- We performed our first federal energy subsidies study at Congress’s request in FY 1992, based on the requirements published in the House Committee on Appropriations’ report on our FY 1992 appropriations. The most obvious subsidies are the direct expenditures and R&D support from the federal budget. Tax expenditure subsidies are targeted tax incentives that producers or consumers of specific forms of energy receive. In this case, the government does not spend money, but it loses revenue that it would have otherwise received.
- Federal government fiscal years begin on October 1 of the preceding calendar year and end on September 30.
- We use the following energy type labels: Biofuels, Biomass, Coal, Conservation, End Use, Geothermal, Hydropower, Natural Gas and Petroleum Liquids, Uncategorized, Nuclear, Other Renewables, Electricity—Smart Grid and Transmission, Refined Coal, Solar, and Wind.
- Federal energy-related R&D falls into three classes: basic research, applied research into developing new technologies and new forms of energy supply, and research into improving existing technologies. Although R&D is a subset of direct expenditures, this report treats it separately due to the importance of R&D for energy technology and markets.
- The U.S. Department of Energy (DOE) administers four credit programs: Title XVII Innovative Technology Loan Guarantee Program (Title XVII), the Advanced Technology Vehicle Manufacturing (ATVM) Loan Program, the Tribal Energy Loan Guarantee Program, and the Carbon Dioxide Transportation Infrastructure Finance and Innovation Program. The DOE’s Loan Programs Office has more information about these programs. The Federal Credit Reform Act of 1990 (FCRA) requires federal agencies to estimate the cost to the government of extending or guaranteeing credit. This cost, referred to as credit subsidy cost, equals the net present value of estimated cash flows from the government minus estimated cash flows to the government over the life of the loan and excluding administrative costs. Title XVII requires that a subsidy cost be paid—through a combination of appropriations and payment by the borrower—prior to finalizing a loan guarantee agreement.
- Congress appropriated additional funding for LIHEAP under the American Rescue Plan Act (ARP) of 2021 (Public Law 117-2).
- According to the Congressional Research Service’s report Energy and Water Development: FY2023 Appropriations (R47293, updated March 20, 2023), Title XVII allows DOE to provide loan guarantees for up to 80% of construction costs for eligible energy projects. In general, successful applicants must pay an up-front fee, or subsidy cost, to cover potential losses under the loan guarantee program. The Inflation Reduction Act (IRA; Public Law 117-169) appropriated $3.6 billion for Section 1703 subsidy costs. IRA also established a time-limited (available through FY 2026), $250 billion Title 17 loan guarantee commitment authority—Section 1706—for Energy Infrastructure Reinvestment Financing. IRA appropriated $5 billion to carry out the Section 1706 program. DOE, “DOE Announces First Loan Guarantee for a Clean Energy Project in Nearly a Decade,” June 8, 2022, https://www.energy.gov/articles/doe-announces-first-loan-guarantee-clean-energy-project-nearly-decade.