Natural Gas Processing Capacity in the Lower 48 States
Release date: February 14, 2019
Introduction
Natural gas processing capacity has increased in recent years, and both processing plant capacity and throughput show a net increase of about 5% in the Lower 48 states between 2014 and 2017, based on EIA estimates. Capacity growth was largely concentrated in areas of high natural gas production growth, such as the Appalachian Basin in the Northeast, the Permian Basin in western Texas and New Mexico, and the Haynesville Shale in Texas and Louisiana. The latest natural gas processing plant data from the triennial Form EIA-757, Natural Gas Processing Plant Survey, Schedule A for 2017 are now available in EIA’s Natural Gas Annual Respondent Query System.
State-by-state changes in processing plant capacity and throughput do not correlate perfectly with changes in natural gas production, despite the link between the two. In regions where infrastructure is already well-developed, such as along the Gulf Coast, new processing capacity may not be necessary to accommodate production increases because existing processing plants may be able to operate at higher utilization rates, and production volumes may be processed in another state or may not require processing to satisfy pipeline standards. Because midstream infrastructure development—the construction of natural gas processing plants and pipelines—requires longer lead time and significant financial outlay, production growth can initially out-pace infrastructure development. The Form EIA-757 data suggest that processors are addressing regional processing bottlenecks by adding processing plants or expanding processing capacity, and that in regions where production is declining, processors are idling, retiring, or running processing plants at lower utilization rates.
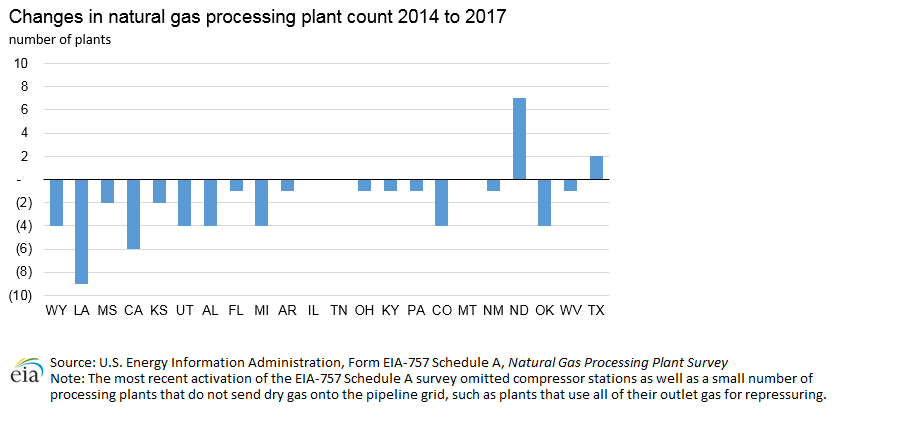
Processing capacity and processing plant throughput increased on a net basis by about 5% between 2014 and 2017 despite a decreasing number of active processing plants. As of the end of 2017, 510 active midstream natural gas processing plants were operating. The 2017 EIA-757 survey data include midstream processing plants that send processed natural gas to market and exclude compressor stations and processing plants that only repressurize natural gas, unlike for the 2014 data collection cycle of the survey. Changes in the count of active processing plants between 2014 and 2017 are because of plants opening up, retiring, or falling out of scope. Compressor stations and plants that only repressurize natural gas are excluded from the list of facilities in the Natural Gas Respondent Query System.
The results of the Form EIA-757 survey are generally consistent with the Form EIA-64A, Annual Report of the Origin of Natural Gas Liquids Production survey results (Table 3), which show the volume of natural gas processed increasing on a net basis by 3% in the Lower 48 states between 2014 and 2017.
- Plant capacity
- Plant throughput
- Inlet heat content
- Change in plant capacity
- Change in plant throughput
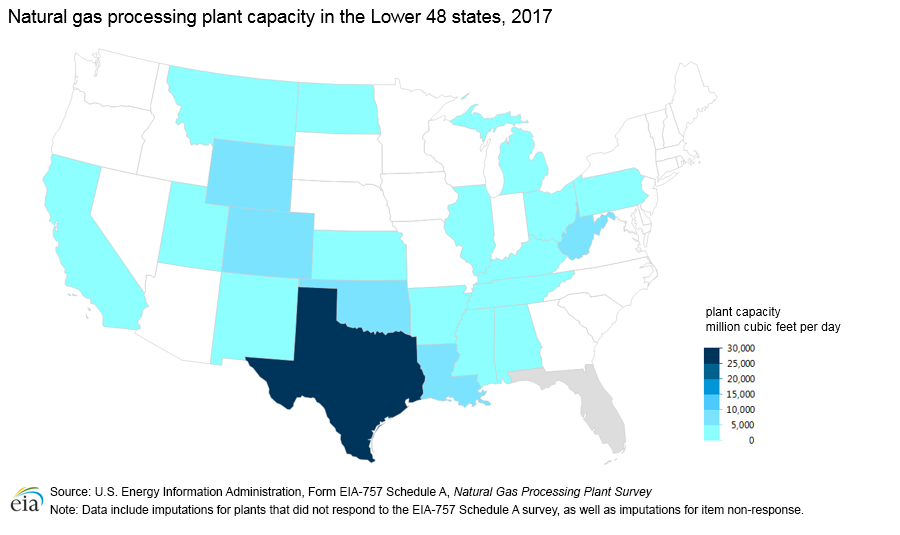
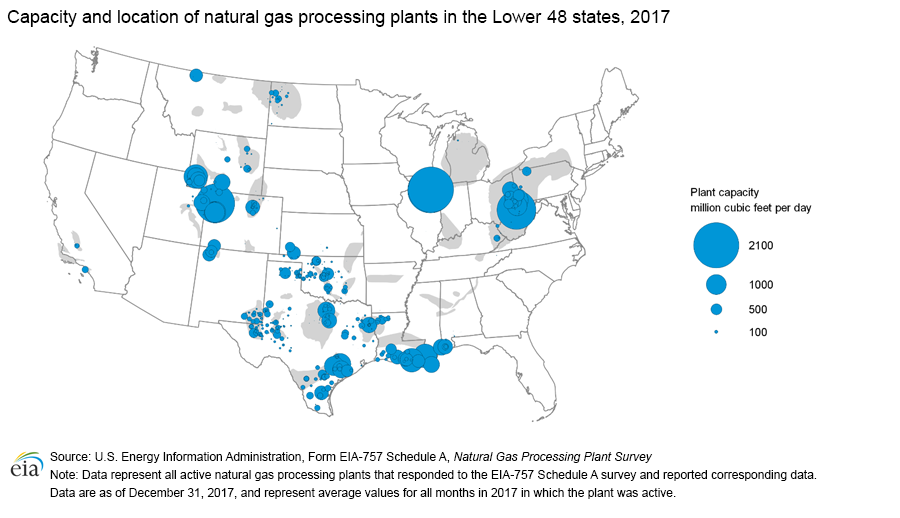
Processing plant capacity
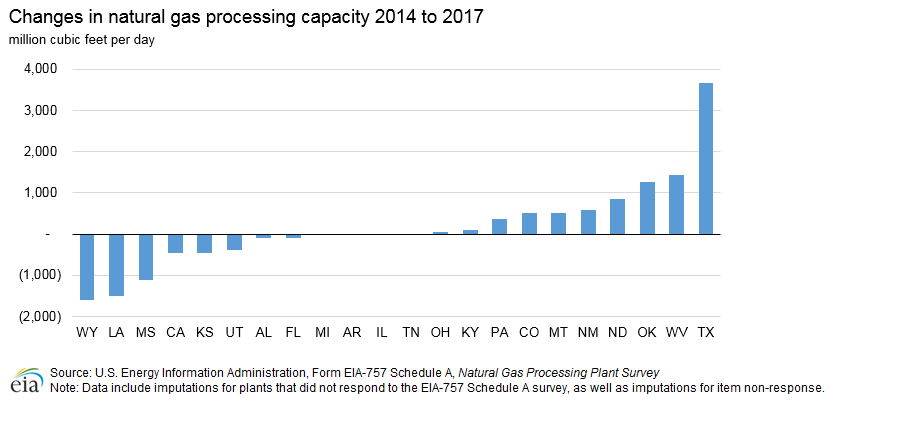
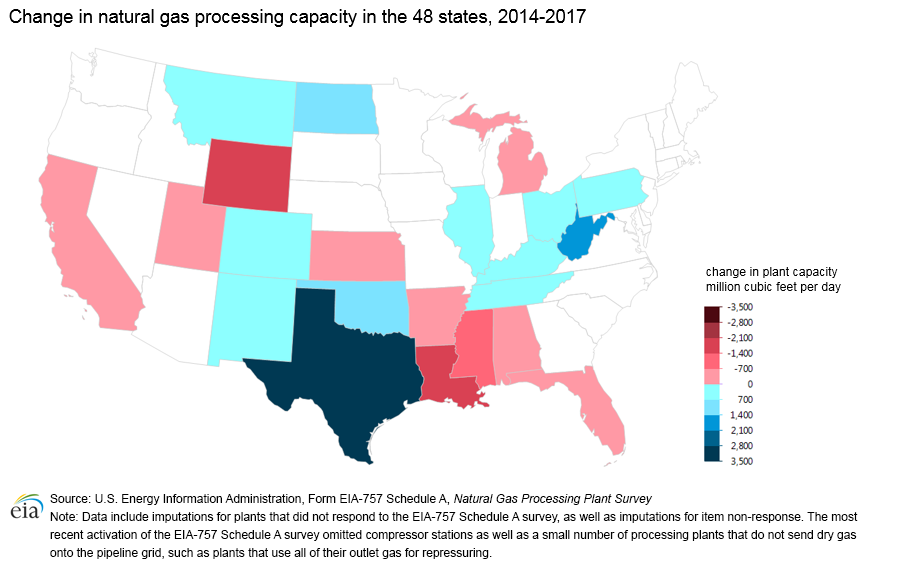
EIA estimates that natural gas processing plant capacity increased by about 5% in the Lower 48 states on a net basis between 2014 and 2017. States showing the most volumetric growth in processing capacity over this period are Texas and surrounding states, states in the Appalachian Basin, and North Dakota and Montana near the U.S. portion of the Bakken formation.
EIA estimates that processing plant capacity (Table 1) grew most rapidly in Texas between 2014 and 2017, increasing by about 3.7 billion cubic feet per day (Bcf/d), or by approximately 15%. During this period, however, natural gas production in Texas declined—likely related to the commodity price of natural gas, which fell substantially between 2014 and 2017, from $4.37 to $2.99 per million British thermal unit on an annualized basis. Oklahoma had a similar increase in processing capacity during this period, expanding by 1.3 Bcf/d, or 19%, while production grew by only 8% during the period. Processing plant capacity may have grown regardless of production because of the significant lead time and financial investment required to build midstream infrastructure. In addition, the U.S. Gulf Coast features a large network of natural gas pipelines, giving producers in the region access to multiple processing facilities and options to process gas in nearby states.
In the Appalachian Basin in the Northeast, West Virginia showed a large increase in processing capacity, up about 1.4 Bcf/d, or 35%, relative to 2014. Similarly, processing capacity in Pennsylvania increased by about 0.4 Bcf/d, or 49%. Processing capacity in Ohio remained essentially flat, despite a significant increases in natural gas production during this period. Many processing plants in the region are located close to shared borders between Pennsylvania, Ohio, and West Virginia, which may explain the minimal change in Ohio’s capacity, because natural gas produced in one state can be processed in another.
In the Bakken formation near the northern border of the United States, North Dakota processing capacity expanded by 0.9 Bcf/d, and Montana processing capacity expanded by 0.5 Bcf/d. In recent years, producers in the Bakken formation have flared large volumes of natural gas, in part because the associated natural gas produced as part of crude oil production often lacked both pipeline infrastructure to reach end-use consumers and the processing infrastructure to remove heavier hydrocarbons from the natural gas. In the last few years, natural gas production in the region has increased faster than oil production, and this production increase is partly attributable to infrastructure buildout in the region, which has also helped reduce flaring.
Wyoming experienced substantial declines in natural gas processing capacity during this period, driven partly by consistent declines in natural gas production from coalbed methane, a source that accounts for much of Wyoming’s production. Traditional production from natural gas wells also declined in the state. Louisiana experienced large decreases in processing capacity, likely related to the long downward trend in offshore production in the Gulf of Mexico.
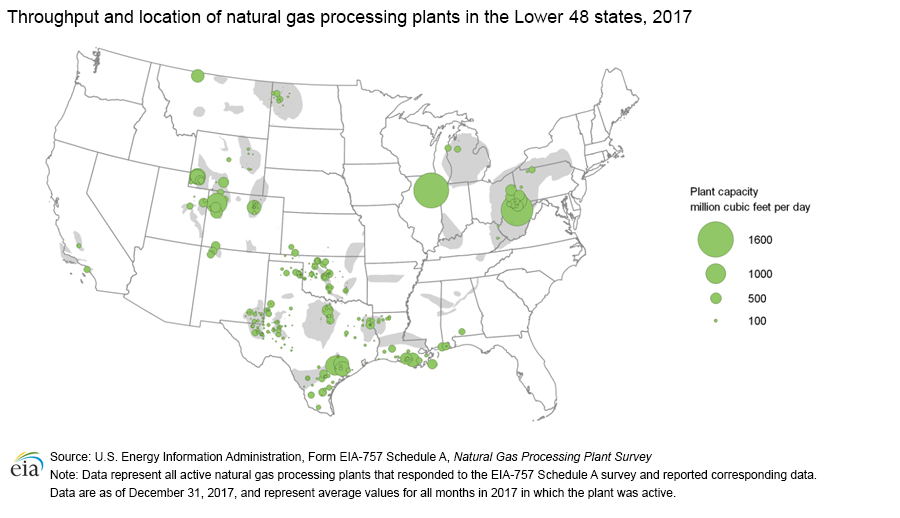
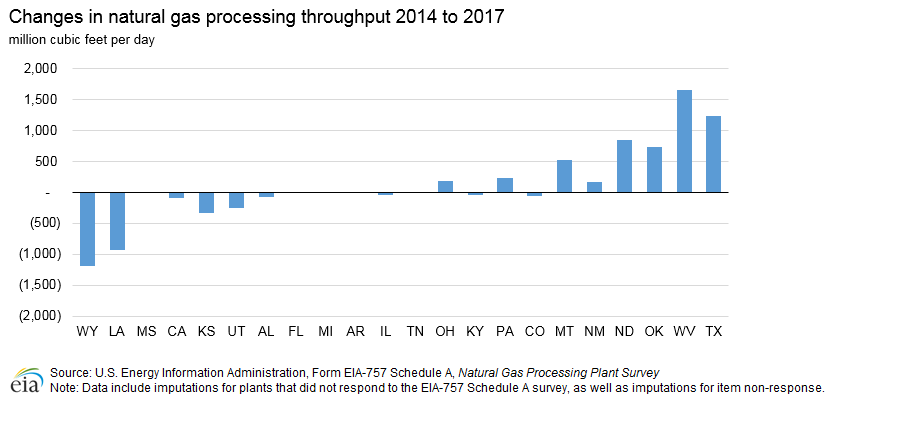
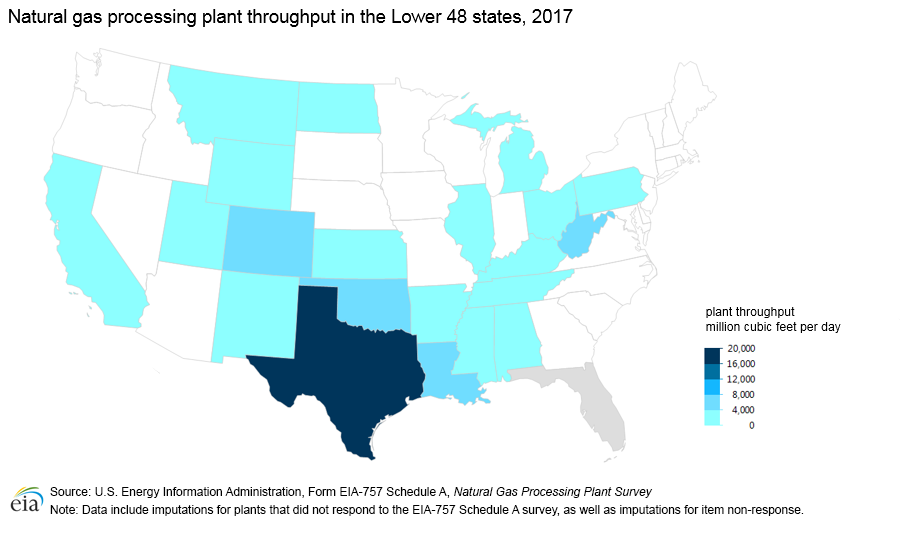
Processing plant throughput
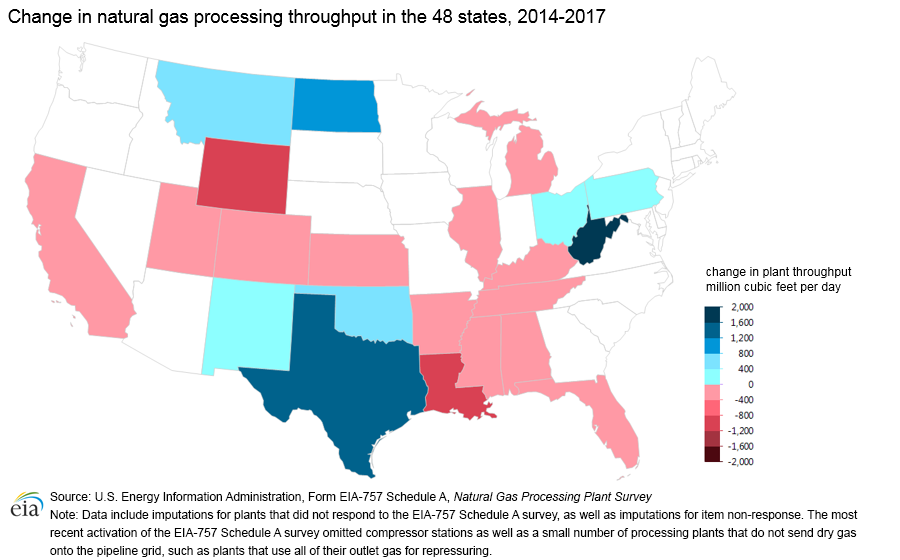
In the Lower 48 states, natural gas processing plant throughput both increased by about 5% between 2014 and 2017 on a net basis according to EIA estimates, and nationally, dry production increased by slightly less than 5% during that period.
Trends in natural gas processing throughput (Table 1) typically track trends in natural gas processing capacity. Volumes of natural gas processed increased the most in Texas and West Virginia and decreased the most in Wyoming and Louisiana.
Utilization rates of natural gas processing plants (Table 2), defined as the ratio of throughput to capacity, remained stable between 2014 and 2017 on a net basis, according to EIA estimates, although results for individual states differed substantially. States with large production growth during the period tended to have higher utilization rates in 2017.
The utilization rate in Texas, which saw a substantial increase in capacity during the report period and a decrease in natural gas production, declined from 75% to 69%. Louisiana, Oklahoma, and New Mexico experienced similar decreases in utilization.
States in the Appalachian Basin tended to show large increases in processing plant throughput, reflecting increased demand for processing as production grew during the period. Utilization in Ohio increased from 55% to 63%, and utilization in West Virginia increased from 66% to 79%. Utilization in Pennsylvania stayed essentially flat.
Utilization rates for states in the Bakken formation increased to accommodate production growth in the region. Utilization in North Dakota increased from 62% to 79%, and utilization in Montana increased from 76% to 96%.
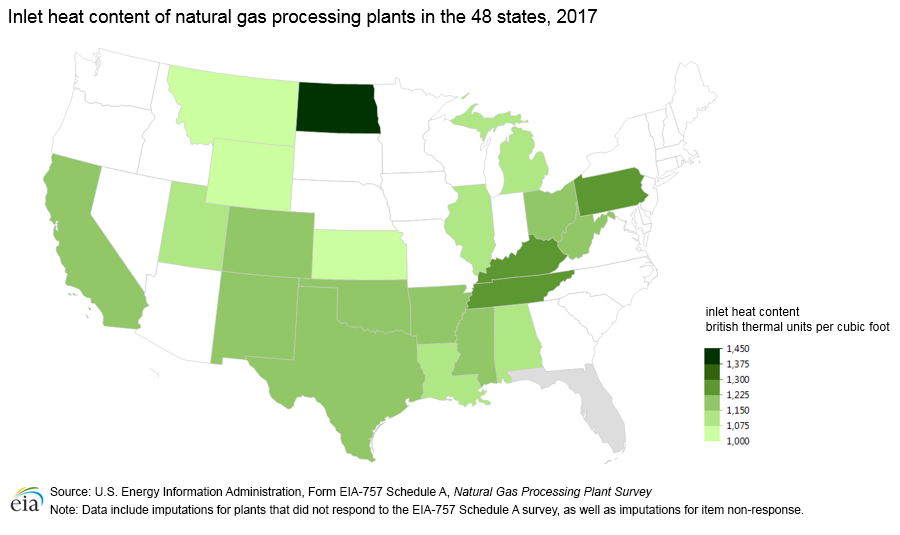
As dry production increased by 5% between 2014 and 2017, natural gas plant liquids production increased by about 19%. Natural gas plant liquids are more energy-dense than dry natural gas, so this is likely the reason that Btu content has trended higher in many states and at the Lower 48-level over this period.
The estimates for natural gas processing plant throughput for 2017 show similar trends in two EIA surveys—the Form EIA-757 and the Form EIA-64A survey (Table 3). Notable differences between the state-level results are the result of two main factors:
- Volumes of natural gas imported from Canada but processed in the United States are of scope of the EIA-64A survey
- Some processing plants were not surveyed on the Form EIA-757 Schedule A survey because they were out of scope (such as compressor stations and processing plants that only do repressuring)
| State | Capacity 2014 | Capacity 2017 | Change | Throughput 2014 | Throughput 2017 | Change |
|---|---|---|---|---|---|---|
| AL | 1,459 | 1,364 | (95) | 613 | 542 | (71) |
| AR | 37 | 12 | (25) | 26 | 11 | (15) |
| CA | 898 | 434 | (464) | 370 | 285 | (85) |
| CO | 6,130 | 6,632 | 504 | 4,541 | 4,476 | (64) |
| FL | 90 | NA | NA | 15 | NA | NA |
| IL | 2,102 | 2,102 | - | 1,683 | 1,634 | (49) |
| KS | 1,664 | 1,211 | (453) | 976 | 651 | (325) |
| KY | 255 | 365 | 110 | 186 | 150 | (36) |
| LA | 10,870 | 9,358 | (1,512) | 5,525 | 4,588 | (937) |
| MI | 126 | 101 | (25) | 52 | 40 | (12) |
| MS | 1,883 | 763 | (1,120) | 407 | 406 | (1) |
| MT | 146 | 655 | 510 | 111 | 629 | 518 |
| ND | 950 | 1,801 | 851 | 592 | 1,431 | 839 |
| NM | 3,323 | 3,917 | 594 | 2,240 | 2,402 | 162 |
| OH | 2,125 | 2,165 | 40 | 1,169 | 1,355 | 186 |
| OK | 6,568 | 7,834 | 1,266 | 5,028 | 5,764 | 736 |
| PA | 754 | 1,120 | 366 | 531 | 771 | 240 |
| TN | 25 | 25 | - | 14 | 12 | (2) |
| TX | 23,987 | 27,650 | 3,663 | 17,931 | 19,174 | 1,242 |
| UT | 2,017 | 1,623 | (394) | 992 | 734 | (258) |
| WV | 4,077 | 5,504 | 1,427 | 2,710 | 4,365 | 1,655 |
| WY | 7,720 | 6,116 | (1,604) | 5,053 | 3,870 | (1,183) |
| L48 Total | 77,205 | 80,752 | 3,637 | 50,766 | 53,290 | 2,540 |
| Source: U.S. Energy Information Administration, Form EIA -757 Schedule A, Natural Gas Processing Plant Survey | ||||||
| State | Utilization 2014 | Utilization 2017 | Btu content 2014 | Btu content 2017 | Plant count 2014 | Plant count 2017 |
|---|---|---|---|---|---|---|
| AL | 42% | 40% | 1,099 | 1,125 | 16 | 12 |
| AR | 70% | 92% | 1,152 | 1,188 | 2 | 1 |
| CA | 41% | 66% | 1,162 | 1,211 | 23 | 17 |
| CO | 74% | 67% | 1,152 | 1,175 | 43 | 39 |
| FL | 17% | NA | 380 | NA | 1 | 0 |
| IL | 80% | 78% | 1,127 | 1,131 | 2 | 2 |
| KS | 59% | 54% | 1,066 | 1,049 | 8 | 6 |
| KY | 73% | 41% | 1,287 | 1,294 | 3 | 2 |
| LA | 51% | 49% | 1,090 | 1,110 | 50 | 41 |
| MI | 41% | 40% | 1,137 | 1,103 | 13 | 9 |
| MS | 22% | 53% | 1,138 | 1,200 | 5 | 3 |
| MT | 76% | 96% | 1,350 | 1,018 | 5 | 5 |
| ND | 62% | 79% | 1,361 | 1,422 | 14 | 21 |
| NM | 67% | 61% | 1,116 | 1,153 | 27 | 26 |
| OH | 55% | 63% | 1,225 | 1,221 | 6 | 5 |
| OK | 77% | 74% | 1,171 | 1,184 | 75 | 71 |
| PA | 70% | 69% | 1,245 | 1,245 | 11 | 10 |
| TN | 56% | 48% | 1,225 | 1,225 | 1 | 1 |
| TX | 75% | 69% | 1,144 | 1,173 | 181 | 183 |
| UT | 49% | 45% | 1,118 | 1,120 | 13 | 9 |
| WV | 66% | 79% | 1,220 | 1,216 | 16 | 15 |
| WY | 65% | 63% | 1,181 | 1,069 | 36 | 32 |
| L48 Total | 66% | 66% | 1,151 | 1,169 | 551 | 510 |
| Source: U.S. Energy Information Administration, Form EIA -757 Schedule A, Natural Gas Processing Plant Survey | ||||||
| Note: Utilization is calculated as the ratio between processing plant throughput and processing plant capacity. Btu contents for each state are calculated as the weighted average heat content across all active processing plants in a given state or at the Lower 48 level. Metrics for utilization and Btu content in Florida are unavailable in 2017, as the only processing plant in Florida was out of scope of the EIA-757A survey for 2017. NA indicates Not Applicable. It applies to states where all processing plants have fallen out of scope of the survey. | ||||||
| State | EIA-64A | EIA-757A |
|---|---|---|
| AL | 447 | 542 |
| AR | 11 | 11 |
| CA | 276 | 285 |
| CO | 4,511 | 4,476 |
| FL | 40 | NA |
| ID | 10 | NA |
| IL | 179 | 1,634 |
| KS | 592 | 651 |
| KY | 140 | 150 |
| LA | 3,679 | 4,588 |
| MI | 37 | 40 |
| MS | 419 | 406 |
| MT | 29 | 629 |
| ND | 1,594 | 1,431 |
| NM | 2,308 | 2,402 |
| OH | 1,626 | 1,355 |
| OK | 5,012 | 5,764 |
| PA | 877 | 771 |
| TN | 12 | 12 |
| TX | 17,461 | 19,174 |
| UT | 760 | 734 |
| WV | 4,688 | 4,365 |
| WY | 3,438 | 3,870 |
| L48 Total | 48,095 | 53,290 |
| Source: U.S. Energy Information Administration, Form EIA -757 Schedule A, Natural Gas Processing Plant Survey, Form EIA-64A, Annual Report of the Origin of Natural Gas Liquids Production | ||
| Note: Volumes of natural gas imported from Canada but processed in the United States are out of scope of the EIA-64A survey, accounting for a large portion of the differences between the two surveys for states such as Illinois and Montana. NA indicates Not Applicable. It applies to states where all processing plants have fallen out of scope of the survey. | ||
Appendix:
Estimates of state-level totals for non-respondents and for omitted data items were imputed using previously submitted Form EIA-757 Schedule A data, current Form EIA-64A data, and publicly available company information.
The 2017 Form EIA-757 Schedule A survey had a response rate of 94%, which accounted for an estimated 98% of capacity volumes and 98% of throughput volumes in the Lower 48 states.