|
Download Data (XLS File) |
|
|||||
|
|||||
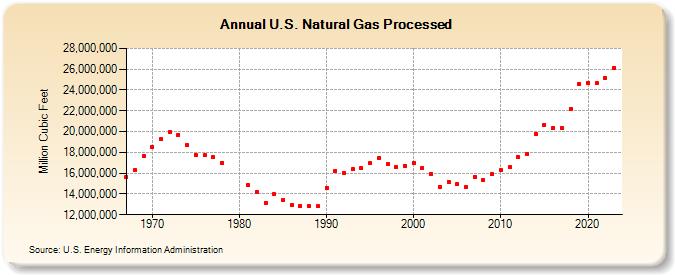
| U.S. Natural Gas Processed (Million Cubic Feet) | |||||
| Decade | Year-0 | Year-1 | Year-2 | Year-3 | Year-4 | Year-5 | Year-6 | Year-7 | Year-8 | Year-9 |
|---|---|---|---|---|---|---|---|---|---|---|
| 1960's | 15,641,633 | 16,316,674 | 17,655,108 | |||||||
| 1970's | 18,509,309 | 19,252,807 | 19,947,740 | 19,679,291 | 18,684,480 | 17,748,426 | 17,717,951 | 17,569,835 | 17,012,234 | |
| 1980's | 14,816,393 | 14,163,667 | 13,173,129 | 13,946,385 | 13,434,644 | 12,949,592 | 12,874,263 | 12,794,932 | 12,810,246 | |
| 1990's | 14,610,303 | 16,229,684 | 16,045,855 | 16,396,894 | 16,459,516 | 16,930,662 | 17,470,017 | 16,836,795 | 16,557,779 | 16,662,873 |
| 2000's | 16,998,687 | 16,511,427 | 15,920,911 | 14,697,316 | 15,190,200 | 14,915,680 | 14,682,188 | 15,663,381 | 15,316,804 | 15,904,517 |
| 2010's | 16,267,757 | 16,566,883 | 17,538,026 | 17,884,427 | 19,754,802 | 20,651,875 | 20,366,695 | 20,388,771 | 22,145,329 | 24,588,053 |
| 2020's | 24,704,380 | 24,664,091 | 25,131,101 | 25,994,474 | 27,088,079 |
| - = No Data Reported; -- = Not Applicable; NA = Not Available; W = Withheld to avoid disclosure of individual company data. |
| Release Date: 6/30/2026 |
| Next Release Date: 7/31/2026 |