
Illinois coal production pushes Illinois Basin production above five-year range
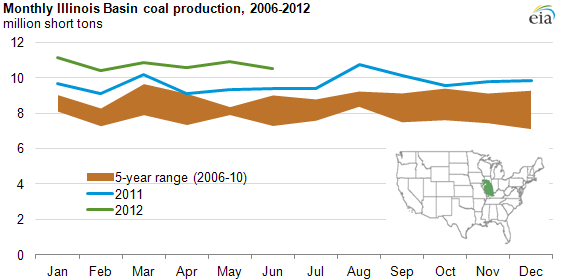
Coal production in the Illinois Basin during the first half of 2012 (64.4 million short tons) was 13% higher than the same period in 2011. This expansion of production, which occurred despite declines in total U.S. coal production and consumption, was a response to both domestic and international demand for cheaper coal.
Located in the central United States, the Illinois Basin ranges across Illinois, Indiana, and western Kentucky. The coal produced in this region is bituminous coal with relatively high sulfur content. Production within the state of Illinois (23.9 million short tons) has been a key driver of the basin production increase over the first half of 2012.
Coal exports to international markets from Illinois increased 120% in 2011 (5.5 million tons) from 2010 (2.5 million tons). In addition, domestic demand for coal from the Illinois Basin, particularly from Illinois itself, increased as a result of a shift in demand toward the Illinois Basin's low-cost, high-sulfur coal and away from Central Appalachia's high-cost, low-sulfur coal. Domestic utilities that have added scrubbers can burn high-sulfur coal while remaining in compliance with recent requirements to reduce sulfur dioxide emissions. Because of the relatively low cost of Illinois Basin coal and its use in larger, efficient plants with modern pollution control equipment, its producers were less affected by recent low natural gas prices.
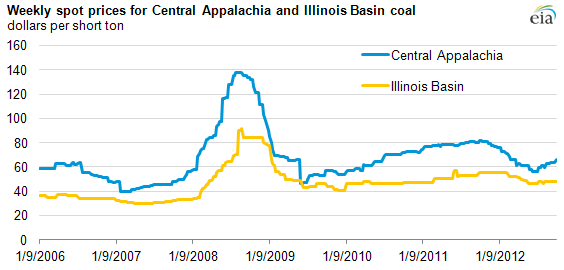
Note: Central Appalachia coal prices are for a Btu value of 12,500 per pound and a sulfur content of 1.2 per pound. Illinois Basin coal prices are for a Btu value of 11,800 per pound and a sulfur content of 5.0 per pound.
New mines boosted Illinois production in contrast to other major coal-producing states, such as Wyoming, West Virginia, and Kentucky, that experienced declines in coal production during second-quarter 2012 as well as mine closures. Between 2010 and third-quarter 2012, eight mines began producing coal in Illinois. They include:
- 2010 – Prairie Eagle Underground
- 2011 – Prairie Eagle South Underground and Hawkeye Mine
- 2012 – Lively Grove Mine, M-C No. 1 Mine, Deer Run Mine, Black Hawk Mine, and Eagle River Mine
In addition to new mines opening, existing mines have begun tapping into new reserves by opening new portals to the coal reserves and excavating new slopes from the surface to the coal seam.
Tags: coal, consumption/demand, exports/imports, Illinois, mining, regulation, states