27 gigawatts of coal-fired capacity to retire over next five years
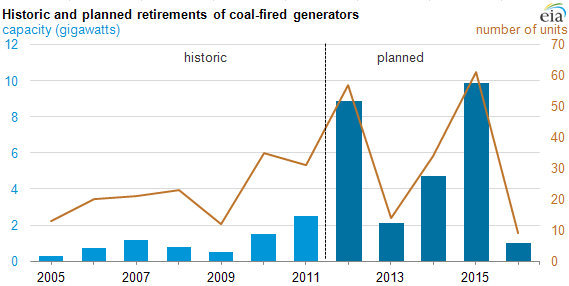
Note: Data for 2005 through 2011 represent actual retirements. Data for 2012 through 2016 represent planned retirements, as reported to EIA. Data for 2011 through 2016 are early-release data and not fully vetted. Capacity values represent net summer capacity.
Plant owners and operators report to EIA that they expect to retire almost 27 gigawatts (GW) of capacity from 175 coal-fired generators between 2012 and 2016. In 2011, there were 1,387 coal-fired generators in the United States, totaling almost 318 GW. The 27 GW of retiring capacity amounts to 8.5% of total 2011 coal-fired capacity.
The coal-fired capacity expected to be retired over the next five years is more than four times greater than retirements performed during the preceding five-year period (6.5 GW). Moreover, based on EIA data, the approximate 9 GW of coal-fired capacity retirements expected to occur in 2012 will likely be the largest one-year amount in the nation's history. The record is, however, expected to be short-lived as almost 10 GW of coal-fired capacity are expected to retire in 2015.
These planned retirement values reflect the early release version of the 2011 reports by plant owners and operators on the Form EIA-860, "Annual Electric Generator Report." The data are subject to change and may not reflect all the retirements that companies are considering. Respondents to this survey include industrial and commercial generators, as well as those in the electric power sector.
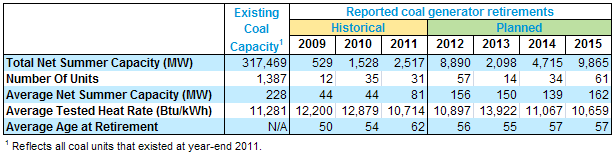
Note: Data for 2009 through 2011 represent actual retirements. Data for 2012 through 2015 represent planned retirements, as reported to EIA. Data for 2011 through 2015 are early-release data and not fully vetted. Capacity values represent net summer capacity.
The table above shows that the coal generators that retired between 2009 and 2011 had an average size of 59 megawatts (MW). By contrast, the average size of a coal-fired plant planned for retirement between 2012 and 2015 is 154 MW, more than twice the average size of the units retired during the 2009-2011 period. Twelve units of at least 200 MW are expected to retire in 2012, including two 790 MW units. Another 13 coal-fired units with generating capacities of 200 MW or greater are expected to retire in 2015—this is close to the average size of all coal units existing in 2011 (228 MW).
The table also underscores that plants planned for retirement are more efficient than previously-retired plants. By 2015, the retiring coal-fired units will have average tested heat rates of about 10,700 British thermal units per kilowatthour; these coal-fired units are approximately 12% more efficient than the group of units, on average, that retired during 2009-2011, but 5% less efficient than the average coal unit.
Note: Capacity values represent net summer capacity.
Around the country, several factors are likely contributing to the increase in planned coal unit retirements:
- Modest demand growth. Slowing electricity demand growth has led to declining use of some of the smaller, older, less efficient coal plants.
- Relative fuel prices. Relative prices of natural gas and coal as sources of energy, which have moved in favor of natural gas with the boom in shale gas production. The variable costs of operating natural gas-fired capacity have fallen relative to those of coal-fired plants.
- Availability of the combined-cycle plant fleet. The availability of highly efficient natural gas combined-cycle power plants that are currently not fully utilized.
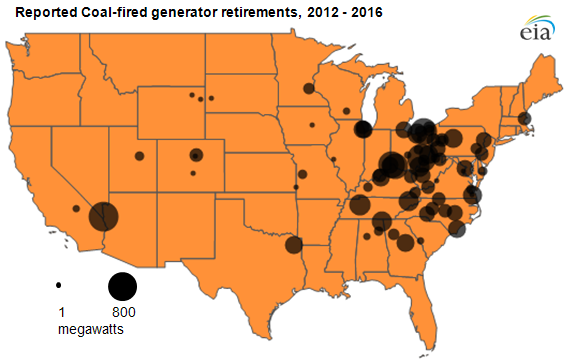
- Aging coal-fired generators. Most of the country's older coal capacity is concentrated in the Mid-Atlantic, Ohio River Valley, and Southeastern U.S (see map above) due to proximity to the primary U.S. coal supply regions at the time of their construction.
- Environmental compliance costs. The cost of compliance with anticipated and existing Federal environmental regulations such as the Mercury and Air Toxics Standards (MATS) is a factor. Particularly in the case of older, smaller units that are not used heavily, owners may conclude it is more cost efficient to retire plants rather than make additional investments.
- Other compliance costs. The cost of compliance with anticipated and existing state laws and regulations including renewable portfolio standards.
Tags: capacity, coal, electricity, map, power plants, retirements