
Natural gas inventories at the end of winter heating season were near five-year average
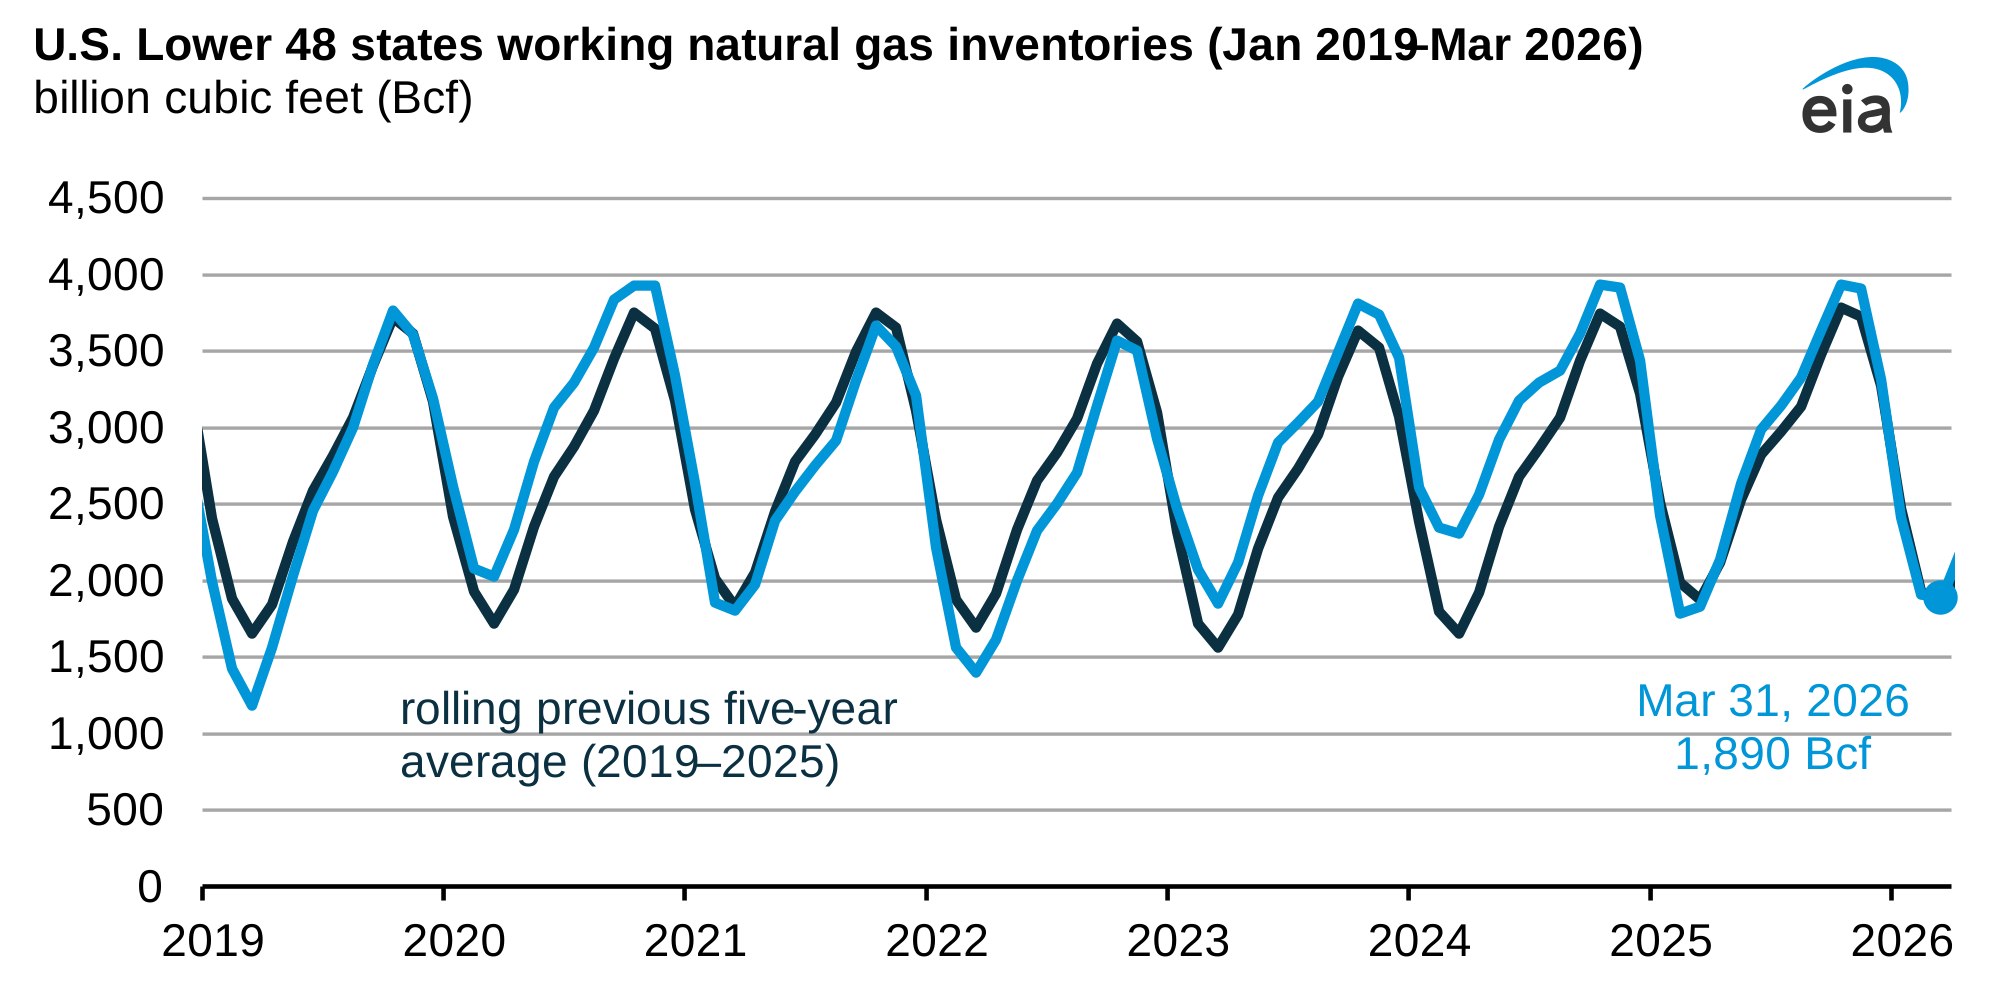
Note: We estimated end-of-month values for March from the Weekly Natural Gas Storage Report.
We estimate the Lower 48 U.S. states began this natural gas injection season (April–October) with 1,890 billion cubic feet (Bcf) of working natural gas in storage, based on interpolated data from our Weekly Natural Gas Storage Report. This level was 3% above the previous five-year (2021–25) average and 3% above last year’s end-of-season storage volume.
After a relatively warm start to the 2025–26 winter heating season (November–March), colder-than-normal temperatures across much of the United States in January, including Winter Storm Fern, resulted in a record storage withdrawal of 360 Bcf for the week ending January 30. Natural gas inventories fell to 5.6% below the previous five-year average in subsequent weeks. However, slower withdrawals due to milder weather in February and March brought inventories back above this threshold. By the week ending March 13, storage levels were 2.6% above the five-year average, and by April 3, they were 4.8% above the average.
U.S. natural gas consumption typically peaks during the winter heating season, when colder temperatures increase demand for space heating in the residential and commercial sectors. Reduced natural gas consumption in these sectors has helped moderate prices since January. Consumption in February and March averaged 42.2 billion cubic feet per day (Bcf/d) and 26.0 Bcf/d, respectively, down from 51.9 Bcf/d in January, according to LSEG Data. Henry Hub averaged $3.04 dollars per million British thermal units (MMBtu) in March, down from $7.72/MMBtu in January and $3.62/MMBtu in February.
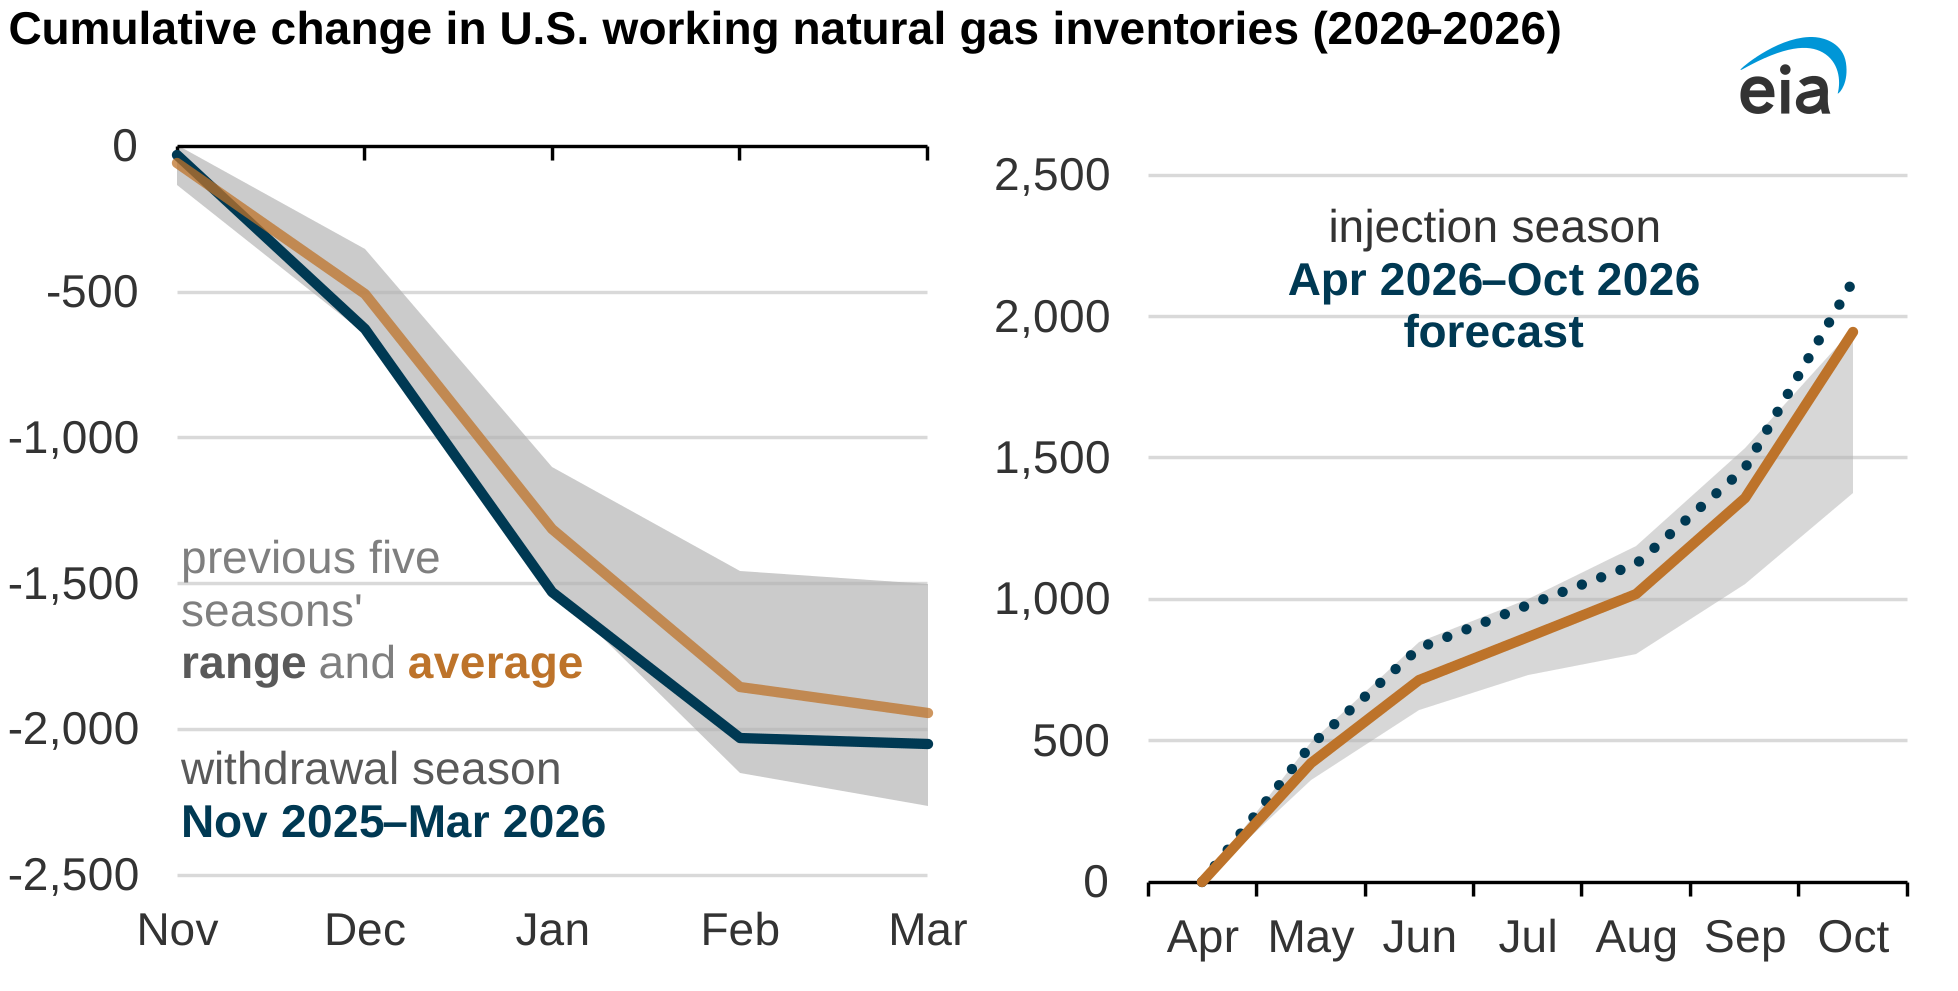
Net withdrawals from natural gas storage during the season totaled 2,048.4 Bcf, 5% more than the five-year average. Weekly withdrawals ranged from a minimum of 11 Bcf in mid-November to a maximum of 360 Bcf in late January.
We expect natural gas injections to exceed the five-year average this injection season, supported by record dry natural gas production. According to our latest STEO, we expect net injections into natural gas storage facilities this season will reach 2,125.2 Bcf, 9% more than the five-year average.
We project the increase in natural gas production will exceed the combined growth in electric power summer demand and year-round LNG exports, enabling more gas to be injected into storage.
Principal contributor: Andrew Iraola
Tags: natural gas, weather, inventories/stocks