High airline jet fuel costs prompt cost-saving measures
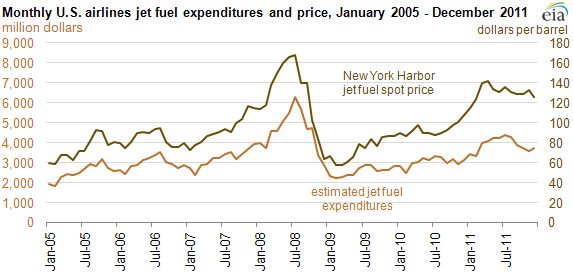
According to Airlines for America, jet fuel represented 30% of a typical U.S. airline's operating expense in the third quarter of 2011. While factors such as the number of flights and efficiency of the fleet influence jet fuel expenditures, historically jet fuel expenditures track jet fuel wholesale prices (see chart above). The increase in airline fuel expenditures has occurred notwithstanding a continued increase in overall fuel efficiency, as indicated by a continuing rise in seat-miles per gallon.
Since 2005, airline fuel efficiency, as measured by airline seat-miles per gallon, has improved. Airlines can improve their fuel efficiency in different ways:
- Deploying more fuel-efficient planes
- Raising load factors on flights, which means making sure flights are close to or at aircraft capacity (all the seats are filled)
- Improving operational efficiencies. Airlines can optimize fuel efficiency by making changes in operations, such as routes flown, flight speed, and idling time.
In an effort to gain additional savings in fuel costs, Delta Air Lines has announced plans to buy the Phillips 66 Trainer refinery located near Philadelphia, Pennsylvania, which has been idled since the fourth quarter of 2011, and invest $100 million to increase the refinery's jet fuel yield. In a recent Securities and Exchange Commission regulatory (8K) filing, Delta stated that it anticipates cost savings of $300 million per year as a result of this purchase.
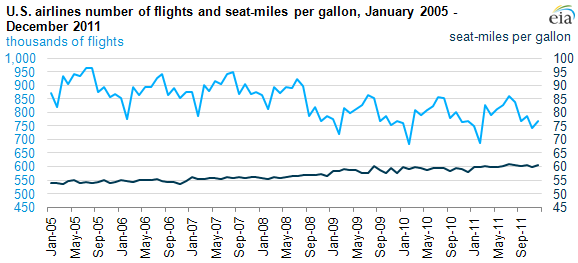
While efficiency has increased between 2005 and 2011, the number of flights has declined over that period. These two factors combined have put downward pressure on jet fuel consumption. In fact, jet fuel consumption by U.S. airlines has dropped from about 18 billion gallons from 2005 to 16 billion gallons in 2011. Even with declining jet fuel consumption, however, jet fuel expenditures are up as a result of increasing jet fuel prices.