
Commercial electricity demand grew fastest in states with rapid computing facility growth
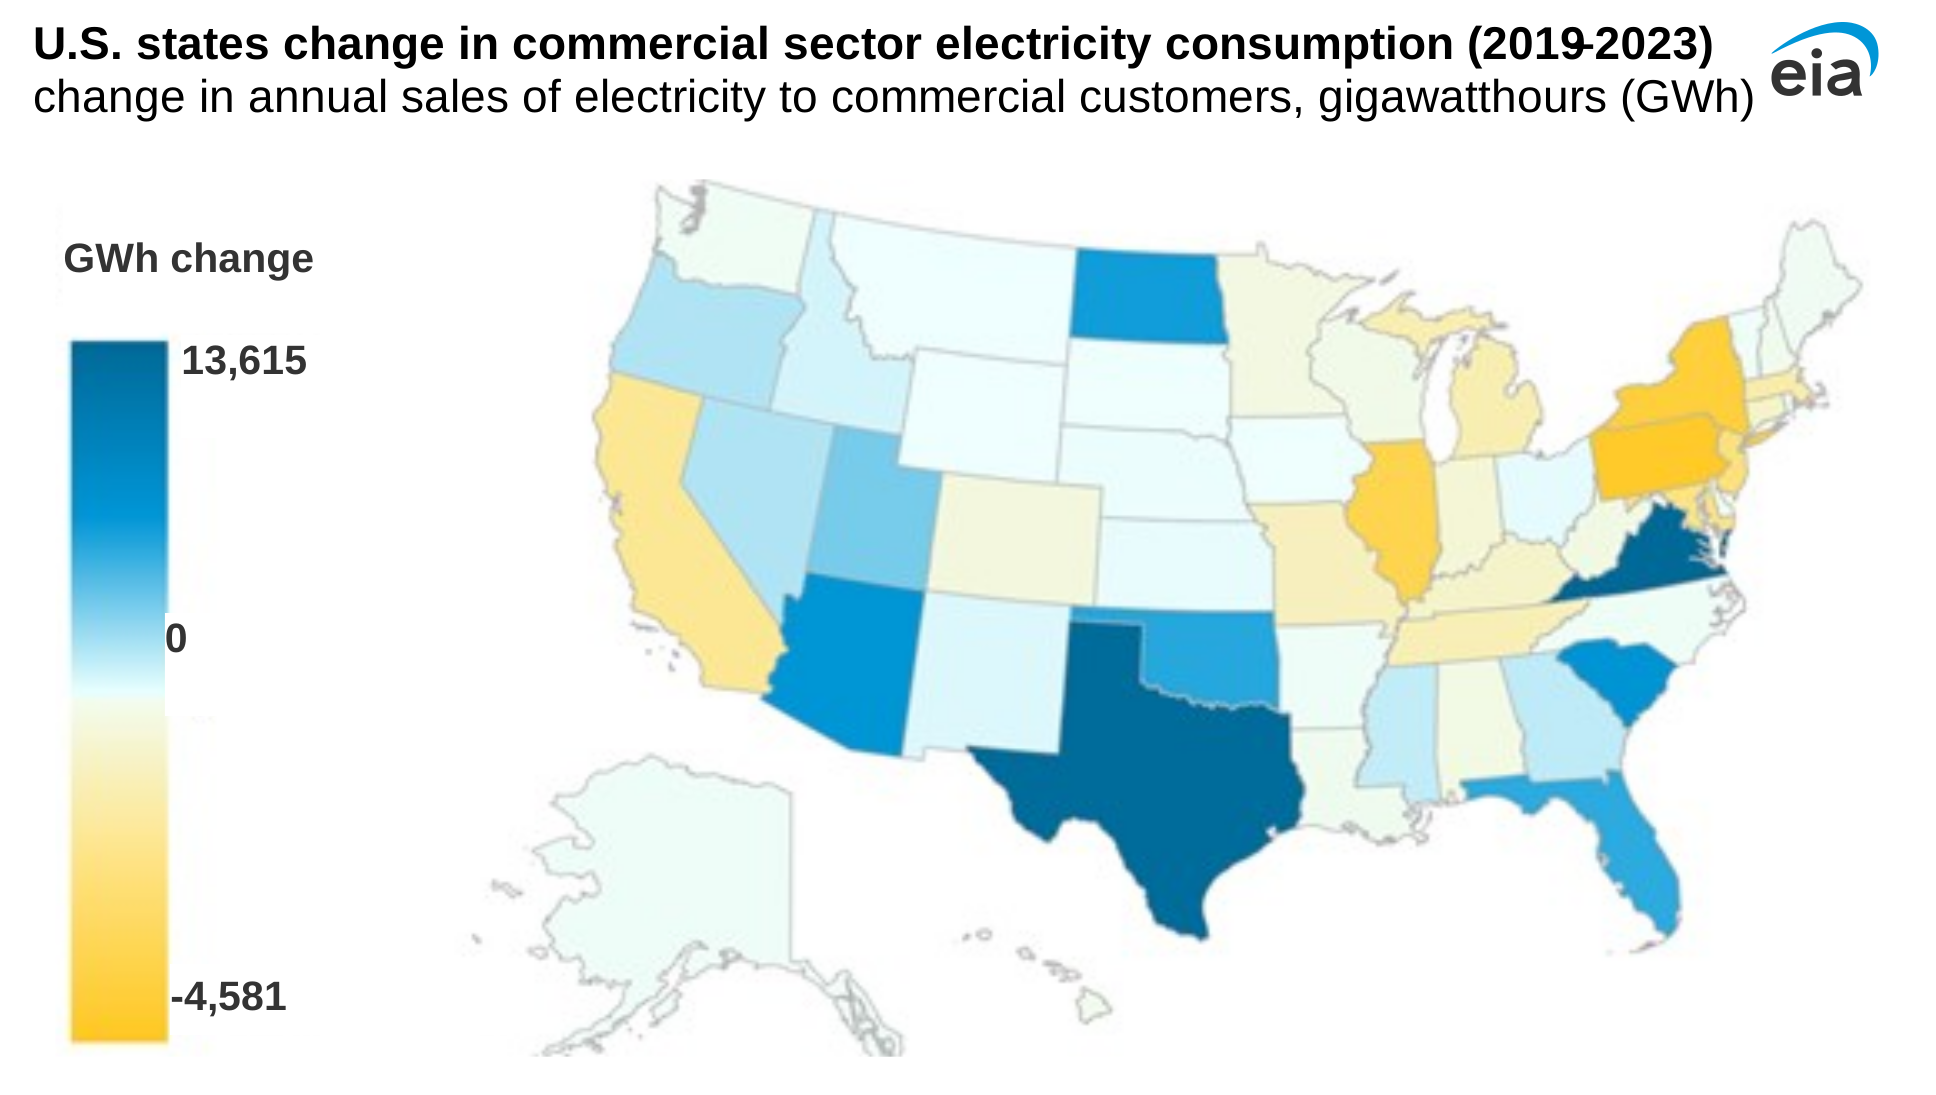
Consumption of electricity in the U.S. commercial sector has recovered from pandemic levels, with annual U.S. sales of electricity to commercial customers in 2023 totaling 14 billion kilowatthours (BkWh), or 1%, more than in 2019. However, the growth in commercial demand for electricity is concentrated in a handful of states experiencing rapid development of large-scale computing facilities such as data centers. Electricity demand has grown the most in Virginia, which added 14 BkWh, and Texas, which added 13 BkWh. Based on our expectation that regional electricity demand will grow, we revised our forecasts upward for commercial electricity demand through 2025 in our June Short-Term Energy Outlook (STEO).
Commercial electricity demand in the 10 states with the most electricity demand growth increased by a combined 42 BkWh between 2019 and 2023, representing growth of 10% in those states over that four-year period. By contrast, demand in the forty other states decreased by 28 BkWh over the same period, a 3% decline. Although growth in the top 10 states has been fairly consistent over time, commercial electricity consumption declined between 2022 and 2023 in a few because of mild summer weather.
Electricity demand has grown the most in Virginia, largely driven by Dominion Energy Virginia, the main electricity utility in the state. Virginia has become a major hub for data centers, with 94 new facilities connected since 2019 given the access to a densely packed fiber backbone and to four subsea fiber cables.
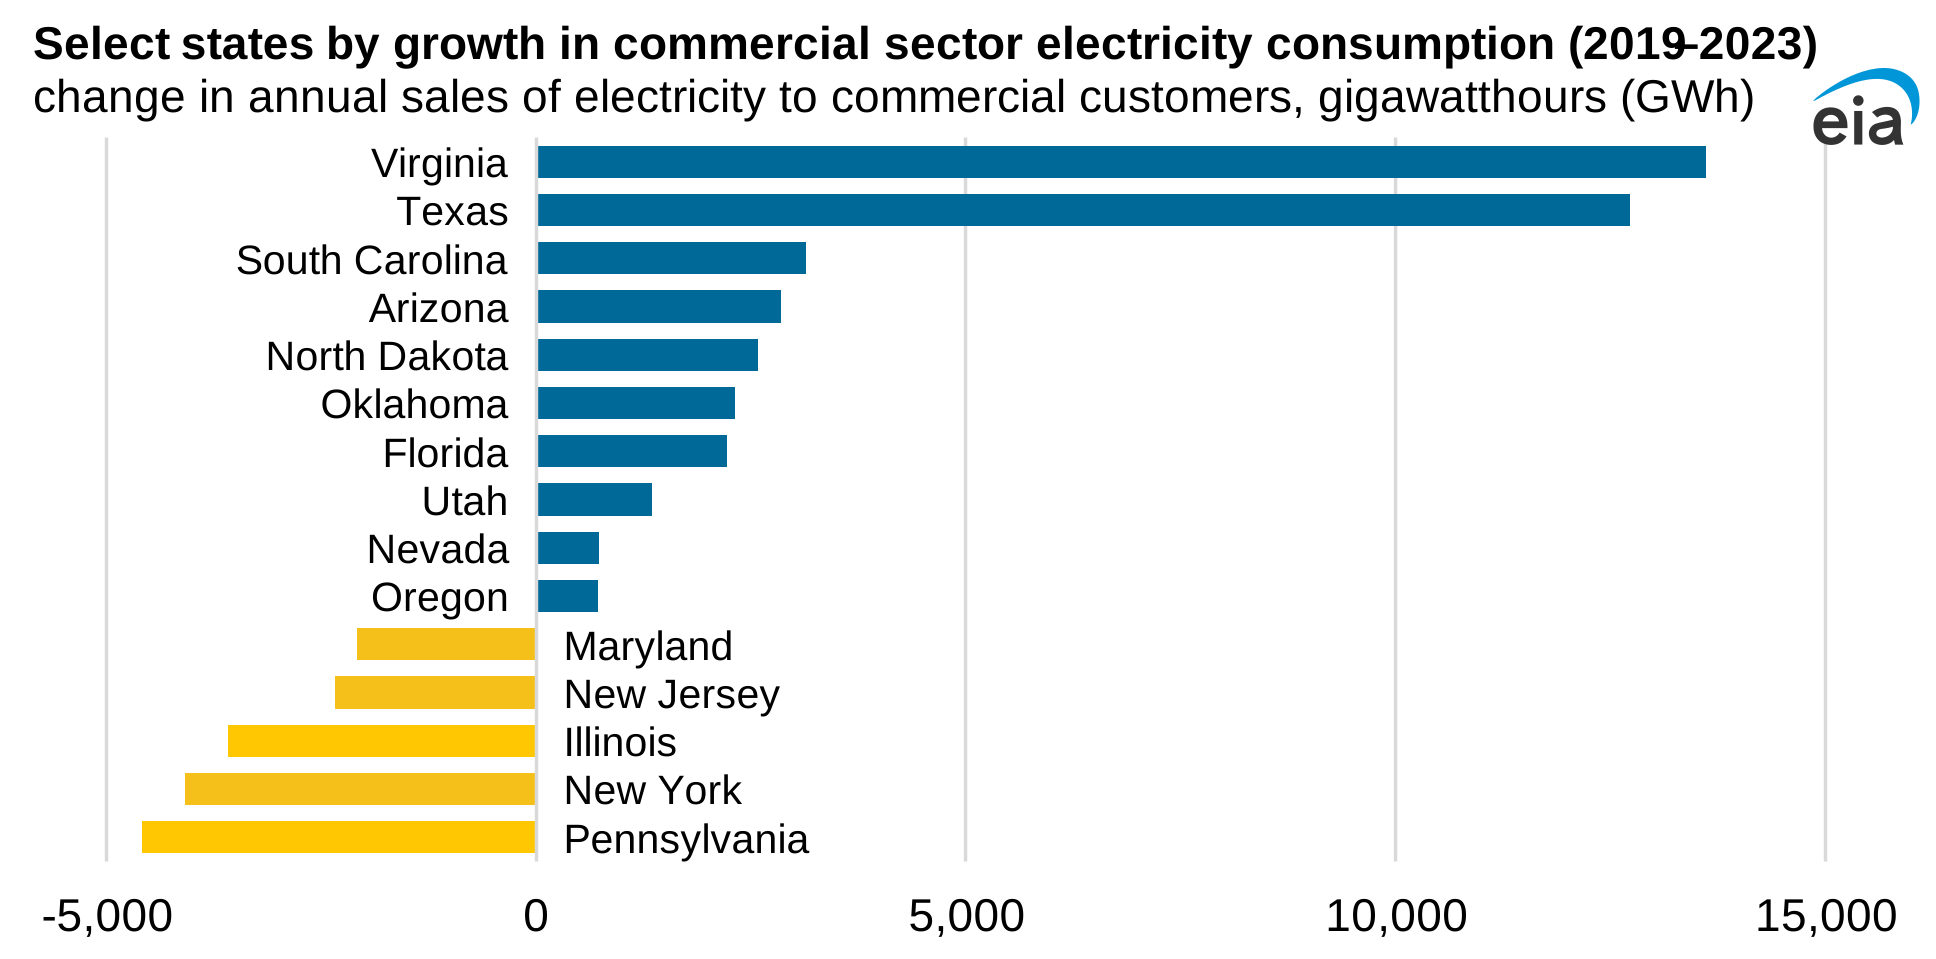
Electricity demand also grew substantially in Texas, where relatively low costs for electricity and land have attracted a high concentration of data centers and cryptocurrency mining operations. North Dakota stands out with the fastest relative growth at 37% (up 2.6 BkWh) between 2019 and 2023, attributed to the establishment of large computing facilities in the state. In addition, western states such as Arizona and Utah have shown robust growth in commercial electricity demand, further contributing to the overall increase in the top 10 states.
In contrast, demand for electricity by the commercial sector in some large states such as New York, Illinois, and California has been flat or has declined compared with 2019.
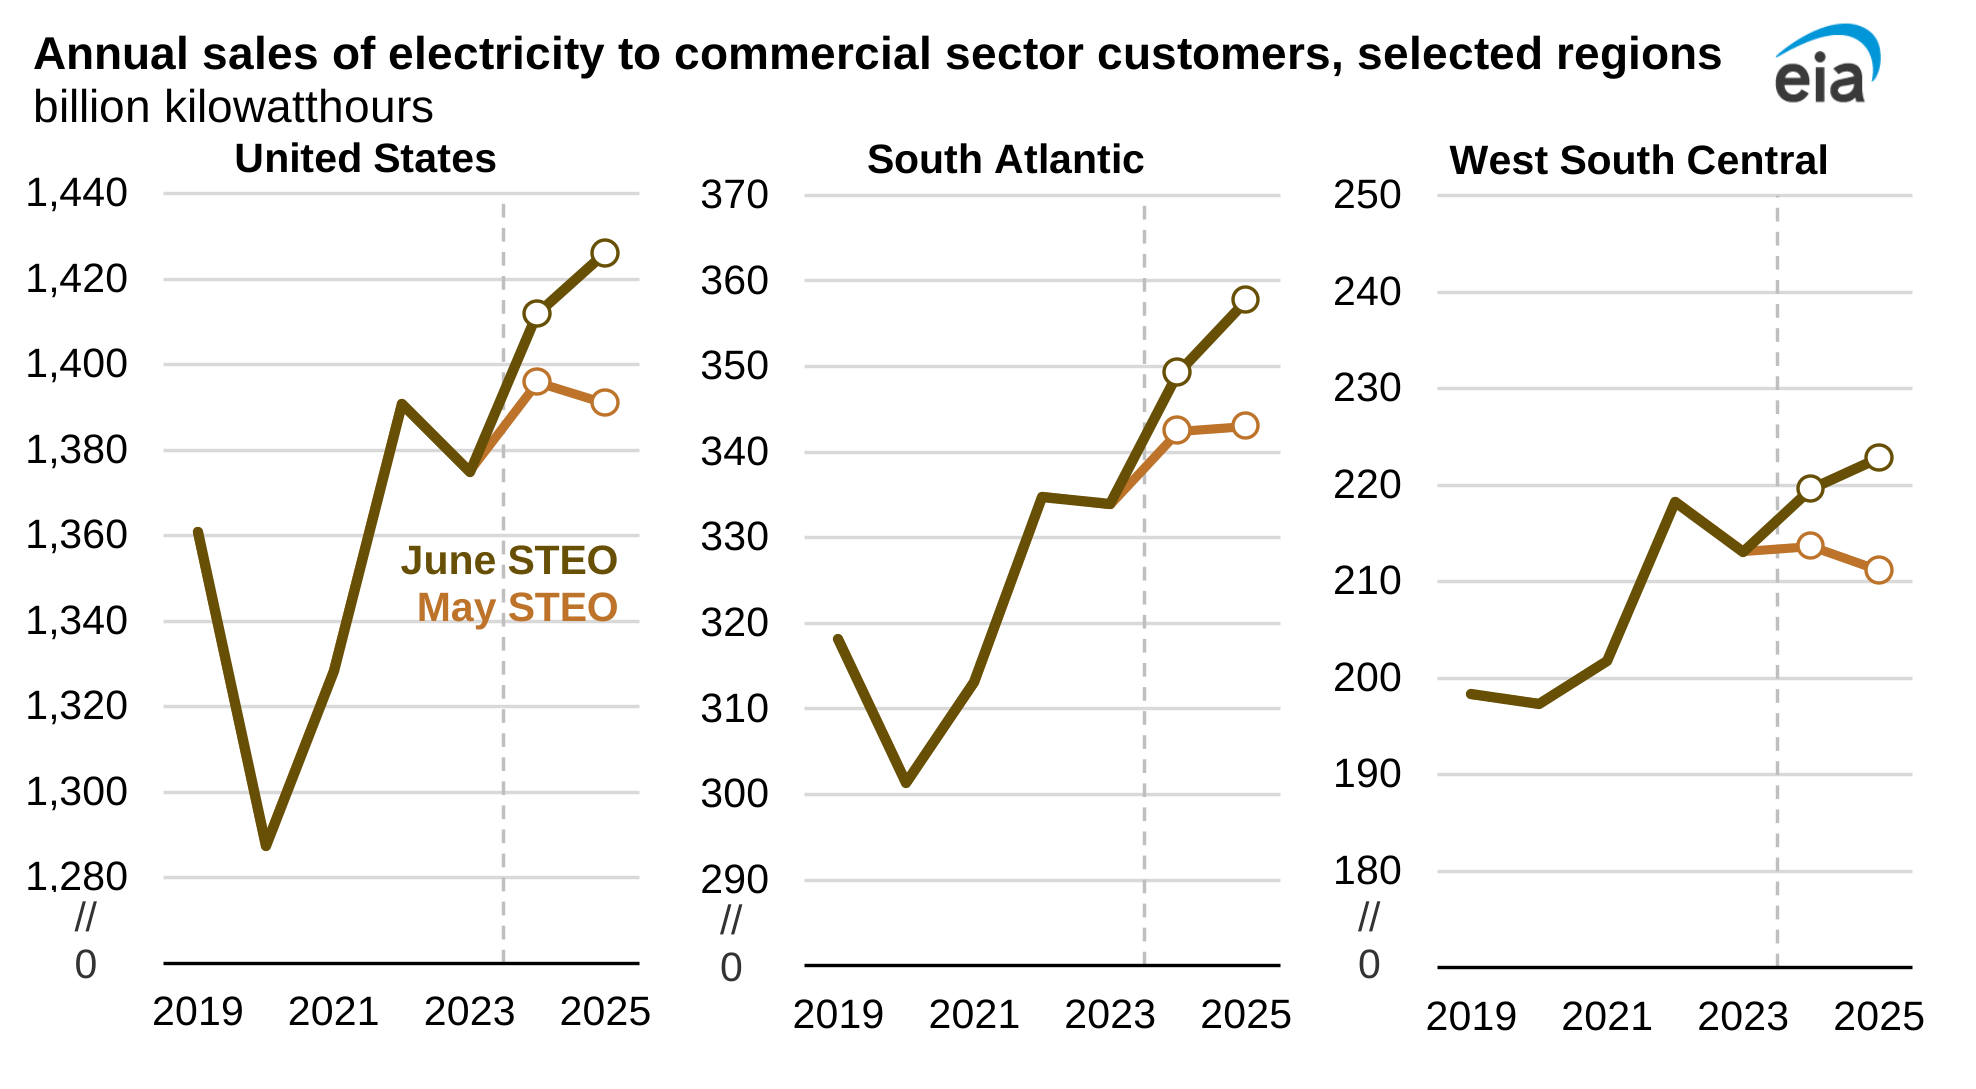
We provide monthly forecasts of retail sales of electricity by sector for the nine census divisions in our Short-Term Energy Outlook. After reviewing information and projections from utilities and grid operators in the areas of the country with rapid data center development, we revised our forecasts upward for commercial electricity demand through 2025.
We made our largest revisions to the forecast in the South Atlantic and West South Central census divisions, which together account for 40% of U.S. commercial electricity demand. We now expect that commercial consumption in the South Atlantic will increase by 5% in 2024 and 2% in 2025 and in West South Central by 3% this year and 1% next year. Other regions with strong growth in sales of electricity to the commercial sector include the West North Central and Mountain census divisions (both with forecast annual growth averaging 3% in 2024 and 2025).
Nationally, we expect U.S. sales of electricity to the commercial sector will grow by 3% in 2024 and by 1% in 2025. Data center developments are evolving rapidly, and we plan to re-evaluate our upcoming forecasts as we receive more information.
Principal contributors: Nilay Manzagol, Tyler Hodge
Map: Jim O'Sullivan