In 2020, the United States produced the least CO2 emissions from energy in nearly 40 years
Note: Click for full U.S. CO2 emissions chart.
From December 20 through December 30, Today in Energy will feature some of our favorite articles from 2021. Today’s article was originally published on July 26.
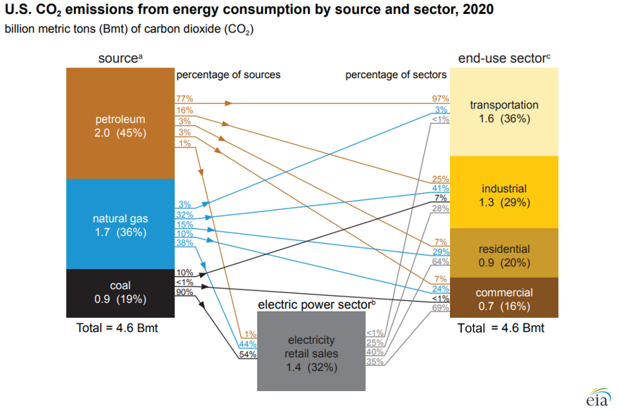
In 2020, as the country responded to the COVID-19 pandemic, CO2 emissions from energy consumption in the United States fell to the lowest level since 1983. The 4.6 billion metric tons (Bmt) of CO2 emitted in 2020 was an 11% decrease from 2019, the largest annual decrease on record, according to our Monthly Energy Review. Our new U.S. CO2 emissions from energy consumption by source and sector chart illustrates CO2 emissions by energy source and sector.
U.S. petroleum consumption accounted for 2.0 Bmt of energy-related CO2 emissions, or about 45% of the U.S. total, in 2020. About 77% of petroleum CO2 emissions occurred in the transportation sector in 2020.
In 2020, U.S. natural gas consumption accounted for 1.7 Bmt of CO2 emissions, or about 36% of the total—its largest share on record. In 2020, about 38% of CO2 emissions from natural gas occurred in the electric power sector, and 32% were in the industrial sector.
In 2020, coal consumption accounted for 0.9 Bmt of CO2 emissions, or about 19% of total CO2 emissions, both its lowest total amount and share in our annual data series that begins in 1973. In 2020, about 90% of CO2 emissions from coal occurred in the electric power sector. Coal consumption in the electric power sector has declined over the past decade, displaced by natural gas and renewable energy.

The electric power sector is an intermediate energy-consuming sector, and therefore, we allocate its CO2 emissions proportionally to the amount of electricity sold to each consumption sector in this chart. In 2020, coal accounted for 54% of electric power CO2 emissions, even though coal accounted for 19% of electricity generation in the electric power sector last year.
The U.S. transportation sector emitted 1.6 Bmt of CO2 in 2020, or about 36% of the nation’s total energy-related CO2 emissions. U.S. transportation sector CO2 emissions dropped 15% from 2019 as a result of the decrease in petroleum consumption for travel during the COVID-19 pandemic. In 2020, petroleum accounted for 97% of U.S. transportation sector CO2 emissions.
The U.S. industrial sector emitted 1.3 Bmt of CO2 in 2020. In 2020, direct consumption of natural gas accounted for 41% of the sector’s CO2 emissions, electric power generation accounted for 28%, petroleum for 25%, and coal for 7%.
The U.S. residential sector emitted 0.9 Bmt of CO2 in 2020, a 6% drop from 2019. Energy consumption in the residential sector was down overall in 2020 despite more people staying at home. In 2020, electric power generation accounted for 64% of residential CO2 emissions, and direct consumption of natural gas accounted for 29%.
The U.S. commercial sector emitted 0.7 Bmt of CO2 in 2020, or 16% of total U.S. energy-related CO2 emissions, the least of any sector. In 2020, 69% of commercial sector CO2 emissions came from electric power generation, and 24% was from direct consumption of natural gas.
As the nation emerges from the COVID-19 pandemic and travel and the economy begin to grow again, we expect CO2 emissions to grow by 0.3 Bmt ( 7%) in 2021, according to the July update of our Short-Term Energy Outlook.
Principal contributor: Brett Marohl