U.S. Energy Information Administration logo
Skip to sub-navigation
December 10, 2021

The Brent crude oil price decline on November 26 was among the largest in years
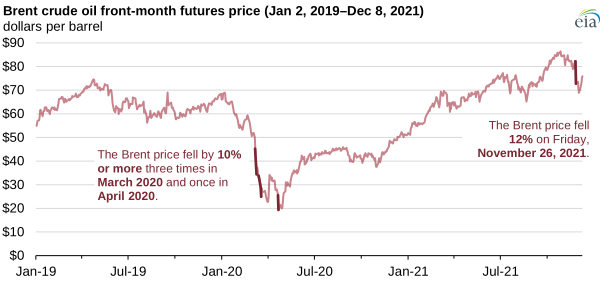
Brent crude oil front-month futures price
Source: Graph by the U.S. Energy Information Administration, based on Intercontinental Exchange and Bloomberg

The front-month futures price for Brent crude oil decreased by $9.50 per barrel, or nearly 12%, on November 26 after the World Health Organization designated the SARS-CoV-2 Omicron variant as a variant of concern. Daily Brent crude oil prices have fallen by at least 10% on only 8 days since 2000.

The front-month futures price is the most actively traded futures contract for Brent crude oil on the Intercontinental Exchange. For the Brent crude oil front-month futures contract, daily prices typically change by less than 2%. In the 5,629 trading days since the start of 2000, Brent crude oil prices remained within 2% of the previous day’s value 72% of the time. This year, before the November 26 price drop, the most the Brent crude oil price decreased in a single day was 6.9%, on March 18.

The November 26 price decline likely reflected market expectations of lower global petroleum consumption in the coming months as a result of the Omicron variant, but other factors could have affected price changes on that day. Friday, November 26 was the day after Thanksgiving and near the end of the calendar month, which is when the front-month Brent futures contract expires. Significant news affecting global petroleum markets, announced at a time when market participants close and open several financial positions, may also have contributed to crude oil price volatility on that day.
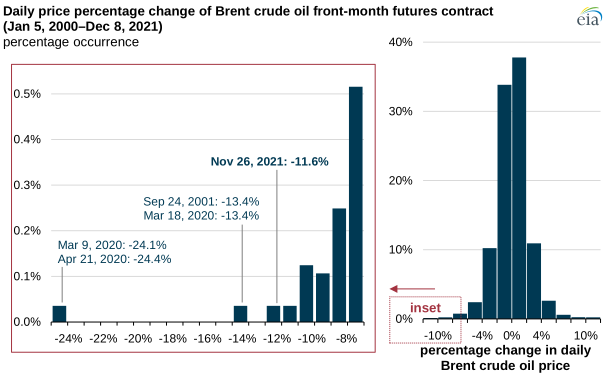
daily price percentage change of Brent crude oil front-month futures contract
Source: Graph by the U.S. Energy Information Administration, based on Intercontinental Exchange and Bloomberg

Principal contributors: Jimmy Troderman, Jeff Barron

Statistics
Analysis
Tools
Education
News

Petroleum & Other Liquids

Crude oil, gasoline, heating oil, diesel, propane, and other liquids including biofuels and natural gas liquids.

Natural Gas

Exploration and reserves, storage, imports and exports, production, prices, sales.

Electricity

Sales, revenue and prices, power plants, fuel use, stocks, generation, trade, demand & emissions.

Coal

Reserves, production, prices, employment and productivity, distribution, stocks, imports and exports.

Nuclear & Uranium

Uranium fuel, nuclear reactors, generation, spent fuel.

Renewable & Alternative Fuels

Includes hydropower, solar, wind, geothermal, biomass and ethanol.

EIA Survey Forms

Forms EIA uses to collect energy data including descriptions, links to survey instructions, and additional information.

Total Energy

Comprehensive data summaries, comparisons, analysis, and projections integrated across all energy sources.

U.S. States

State energy information, including overviews, rankings, data, and analyses.

International

International energy information, including overviews, rankings, data, and analyses.

Environment

Greenhouse gas data, voluntary reporting, electric power plant emissions.

Data Tools, Apps, & Maps

Tools to customize searches, view specific data sets, study detailed documentation, and access time-series data.

Open Data

EIA's free and open data available as API, Excel add-in, bulk files, and widgets

EIA Beta

Come test out some of the products still in development and let us know what you think!

Open Source Code

EIA's open source code, available on GitHub.

RSS Feeds

Subscribe to feeds for updates on EIA products including Today in Energy and What's New.