
U.S. natural gas storage capacity has remained flat over the past eight years
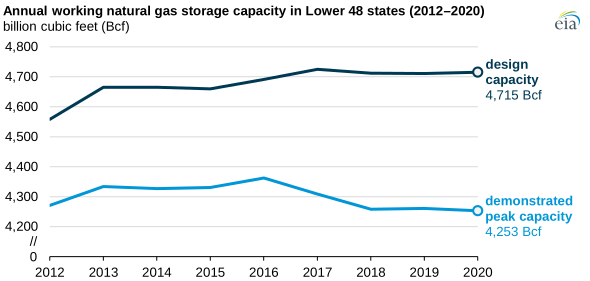
Underground natural gas working storage capacity in the Lower 48 states has remained relatively flat since 2012. We measure natural gas working storage capacity in two ways: design capacity and demonstrated peak capacity. Both measures of capacity were relatively unchanged in 2020 compared with 2019: design capacity increased 0.1% and demonstrated peak capacity decreased 0.2%. The largest regional year-over-year change was a decrease in demonstrated peak capacity in the Pacific region.
We calculated design capacity in our latest estimate as the total working natural gas capacity for all active facilities in the Lower 48 states as of November 2020. Design capacity is an engineering estimate based on the physical characteristics of the reservoir, installed equipment, and operating procedures at the site, which often must be certified by federal or state regulators. Design capacity increased by 4 billion cubic feet (Bcf) in 2020.
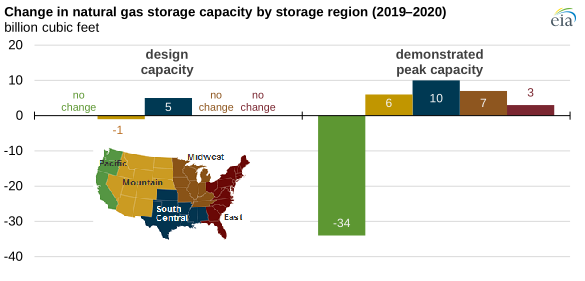
Increases in design capacity during 2020 occurred primarily in the South Central region, where working natural gas design capacity increased by 5 Bcf.
We calculate demonstrated peak capacity as the total of the highest storage levels reached by each storage facility during any month during the most recent five-year period (December 2015–November 2020). Demonstrated peak capacity reflects how storage facilities were actually used rather than how they were designed.
Overall, demonstrated peak capacity in 2020 declined by 8 Bcf compared with 2019, despite reported increases in five of the six regions in the Lower 48 states.
Demonstrated peak capacity declined by 34 Bcf in the Pacific region because previous peak levels—predating the 2015 leak at the Aliso Canyon natural gas storage facility in California—are no longer included in the five-year range. The Aliso Canyon field has operated at reduced levels since coming back online following the leak. Despite the decline in demonstrated peak capacity for the region, natural gas storage facilities in the Pacific region had increased use during 2020 compared with 2019.
You can find additional information and facility-level analysis in our Underground Natural Gas Working Storage Capacity report.
Principal contributor: Jose Villar
Tags: storage, natural gas, storage capacity