The Strait of Hormuz is the world's most important oil transit chokepoint

From December 23 through January 3, Today in Energy will feature a selection of our favorite articles from 2019. Today’s article was originally published on June 20.
The Strait of Hormuz, located between Oman and Iran, connects the Persian Gulf with the Gulf of Oman and the Arabian Sea. The Strait of Hormuz is the world's most important oil chokepoint because of the large volumes of oil that flow through the strait. In 2018, its daily oil flow averaged 21 million barrels per day (b/d), or the equivalent of about 21% of global petroleum liquids consumption.
Chokepoints are narrow channels along widely used global sea routes that are critical to global energy security. The inability of oil to transit a major chokepoint, even temporarily, can lead to substantial supply delays and higher shipping costs, resulting in higher world energy prices. Although most chokepoints can be circumvented by using other routes that add significantly to transit time, some chokepoints have no practical alternatives.
Volumes of crude oil, condensate, and petroleum products transiting the Strait of Hormuz have been fairly stable since 2016, when international sanctions on Iran were lifted and Iran’s oil production and exports returned to pre-sanctions levels. Flows through the Strait of Hormuz in 2018 made up about one-third of total global seaborne traded oil. More than one-quarter of global liquefied natural gas trade also transited the Strait of Hormuz in 2018.
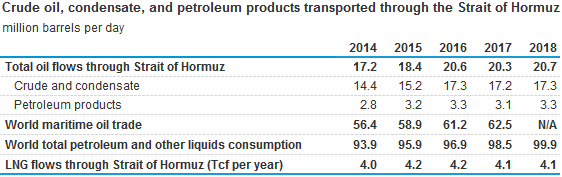
Note: LNG is liquefied natural gas; Tcf is trillion cubic feet
There are limited options to bypass the Strait of Hormuz. Only Saudi Arabia and the United Arab Emirates have pipelines that can ship crude oil outside the Persian Gulf and have the additional pipeline capacity to circumvent the Strait of Hormuz. At the end of 2018, the total available crude oil pipeline capacity from the two countries combined was estimated at 6.5 million b/d. In that year, 2.7 million b/d of crude oil moved through the pipelines, leaving about 3.8 million b/d of unused capacity that could have bypassed the strait.
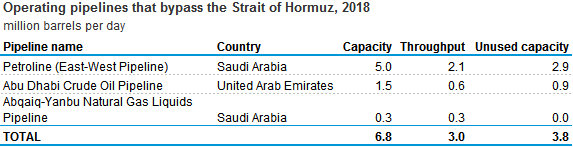
Note: Unused capacity is defined as pipeline capacity that is not currently used but can be readily available.
Based on tanker tracking data published by ClipperData, Saudi Arabia moves the most crude oil and condensate through the Strait of Hormuz, most of which is exported to other countries (less than 0.5 million b/d transited the strait in 2018 from Saudi ports in the Persian Gulf to Saudi ports in the Red Sea).
EIA estimates that 76% of the crude oil and condensate that moved through the Strait of Hormuz went to Asian markets in 2018. China, India, Japan, South Korea, and Singapore were the largest destinations for crude oil moving through the Strait of Hormuz to Asia, accounting for 65% of all Hormuz crude oil and condensate flows in 2018.

In 2018, the United States imported about 1.4 million b/d of crude oil and condensate from Persian Gulf countries through the Strait of Hormuz, accounting for about 18% of total U.S. crude oil and condensate imports and 7% of total U.S. petroleum liquids consumption.
Principal contributor: Justine Barden
Tags: liquid fuels, crude oil, oil/petroleum, map, chokepoints