The United States is expected to export more energy than it imports by 2020
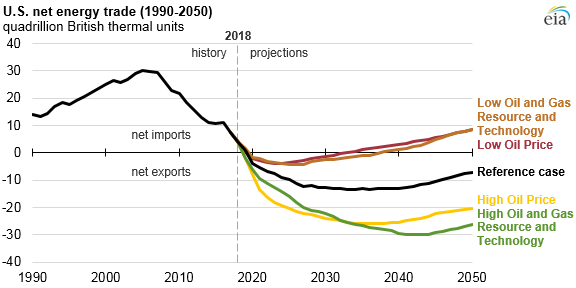
EIA projects that, for the first time since the 1950s, the United States will export more energy than it imports by 2020 as increases in crude oil, natural gas, and natural gas plant liquids production outpace growth in U.S. energy consumption. Different assumptions about crude oil prices and resource extraction affect how long EIA projects that the United States will export more energy than it imports. The United States has been a net exporter of coal and coke for decades, began exporting more natural gas than it imports in 2017, and is projected to export more petroleum and other liquids than it imports within the decade.
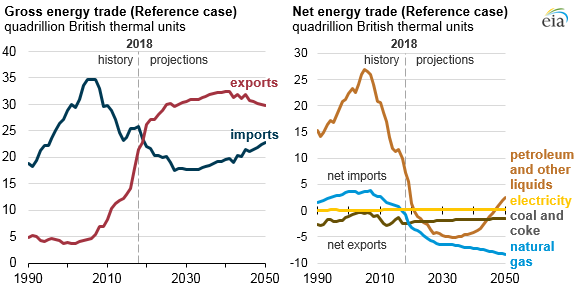
The United States has imported more energy than it exports on an annual basis since 1953, when trade volumes were much smaller. Since then, when imports of energy totaled 2.3 quadrillion British thermal units (Btu), gross energy imports generally grew, reaching a peak of 35 quadrillion Btu in 2005. Gross energy exports were as low as 4 quadrillion Btu as recently as 2002 but have since risen to more than 20 quadrillion Btu in 2018, largely because of changes in liquid fuels and natural gas trade.
EIA’s projected changes in net energy trade are driven mostly by evolving trade flows of liquid fuels and natural gas. In the Reference case of EIA’s newly released Annual Energy Outlook (AEO), the United States exports more petroleum and other liquids than it imports after 2020 as U.S. crude oil production increases and domestic consumption of petroleum products decreases. Near the end of the projection period, the United States returns to importing more petroleum and other liquids than it exports on an energy basis as a result of increasing domestic gasoline consumption and falling domestic crude oil production in those years.
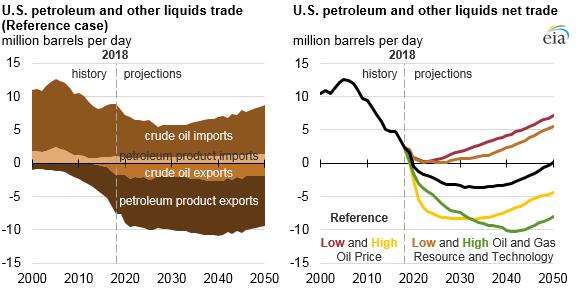
Note: Net trade series in physical units may be different than those shown in energy units (British thermal units) because of differences in energy content of the components.
U.S. natural gas trade in the AEO Reference case, which includes shipments by pipeline from and to Canada and to Mexico as well as exports of liquefied natural gas (LNG), is increasingly dominated by LNG exports to more distant destinations. Increasing natural gas exports to Mexico are a result of more pipeline infrastructure to and within Mexico, allowing for increased natural gas-fired power generation. As natural gas demand grows in Asia and U.S. natural gas prices remain competitive, LNG export capacity increases further before leveling off after 2030 when additional suppliers enter the global LNG market and U.S. LNG is no longer as competitive. EIA projects the difference between natural gas exports and imports to increase throughout the AEO projection period, reaching a high of 23 billion cubic feet per day (Bcf/d) in 2050.
The United States continues to export more coal than it imports (including coal coke) through 2050 in the Reference case, but coal exports do not increase because of competition from other global suppliers closer to major world markets. Trade of electricity with neighboring Canada and Mexico is a relatively small part of U.S. net energy trade flows.
In the AEO Reference case, which reflects current laws and regulations, the United States begins exporting more energy than it imports on an annual basis in 2020 and maintains that status through 2050. In some side cases, the United States again imports more energy than it exports by the mid- to late-2030s.
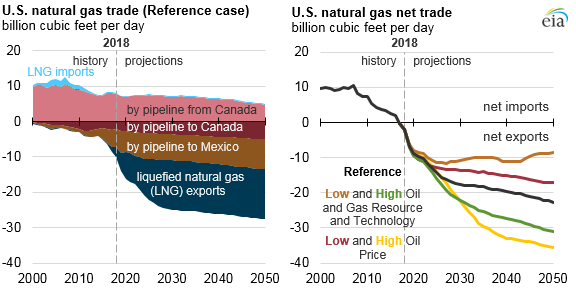
Note: Net trade series in physical units may be different than those shown in energy units (British thermal units) because of differences in energy content of the components.
In the AEO’s Low Oil Price case, lower crude oil prices lead to lower crude oil and natural gas production, and the United States returns to importing more energy than it exports by 2035. Similarly, in the Low Oil and Gas Resource and Technology case, crude oil and natural gas production is lower than in the Reference case, and the United States becomes a net energy importer again in 2039.
Principal contributor: Terry Yen