OPEC net oil revenues in 2016 were the lowest since 2004
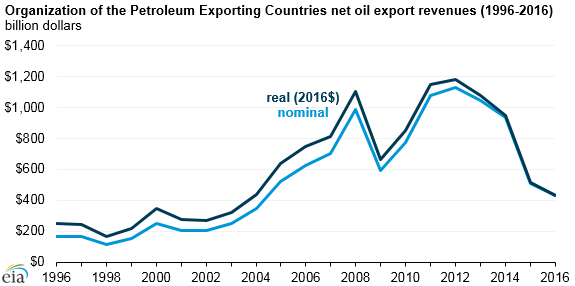
Members of the Organization of the Petroleum Exporting Countries (OPEC) earned about $433 billion in net oil export revenues in 2016, the lowest since 2004. In real dollar terms, the 2016 revenue represents a 15% decline from the $509 billion earned in 2015, mainly because of the fall in average annual crude oil prices and, to a lesser extent, because of decreases in OPEC net oil exports.
EIA projects that OPEC net oil export revenues will rise to about $539 billion dollars (nominal) in 2017, based on the forecast of global oil prices and OPEC production levels in EIA's May 2017 Short-Term Energy Outlook (STEO). The expected increase in OPEC's net export earnings is attributed to slightly higher forecast annual crude oil prices in 2017 as well as slightly higher OPEC output during the year.
For 2018, OPEC net oil export revenues are forecast to be $595 billion (nominal), with an increase in forecast crude oil prices and higher OPEC production and exports contributing to the rise in overall earnings.
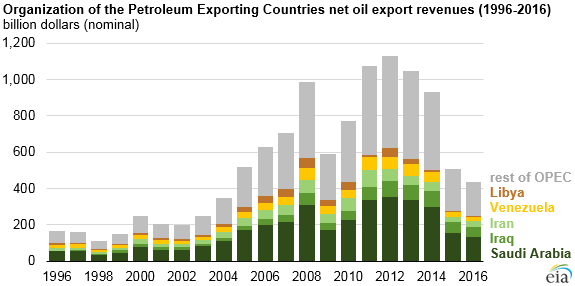
Saudi Arabia has consistently earned more oil export revenues than any other member of OPEC, with its share in total OPEC net oil export revenues ranging between 29% and 34% since 1996. Iran's revenue share has fluctuated, with a significant reduction evident over the 2012–15 period mainly as a result of the imposition of nuclear-related sanctions by the United States and the European Union that targeted Iran’s oil exports. These sanctions resulted in roughly 800,000 barrels per day of Iranian production being shut-in between January 2012 and December 2015. Iran was the only OPEC member country whose net oil revenues increased in 2016, when its share of total OPEC net oil export revenues increased to 8%.
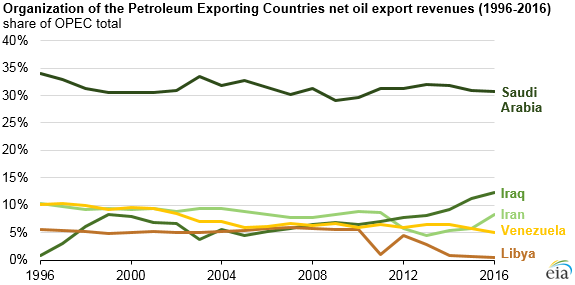
Libya’s share of total OPEC oil export revenues has fluctuated since 2010 as the country’s oil sector was disrupted during the civil war that overthrew the Gadhafi regime and, more recently, as warring factions in the country have repeatedly targeted oil sector installations.
Iraq, however, has seen a substantial increase in oil output since 2010, with its revenues accounting for 12% of the OPEC total in 2016. During the early 1990s, Iraq’s revenues had fallen to less than 1% of OPEC’s total as Iraqi oil production was largely shut-in following its August 1990 invasion of Kuwait and the subsequent United Nations oil embargo that lasted until May 2003. Iraqi oil export revenues increased after 1996 under the United Nations’ oil-for-food program, which permitted revenue from Iraqi oil exports to purchase only food and medicine for war reparations and for other specific authorized purposes.
Principal contributor: Lejla Villar
Tags: liquid fuels, oil/petroleum, OPEC, revenue