U.S. coal exports and imports both decline in 2016 as U.S. remains net coal exporter
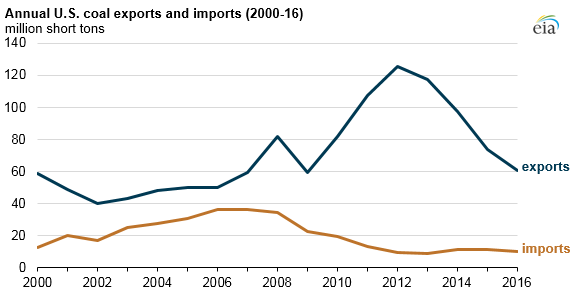
The United States remained a net exporter of coal in 2016, exporting 60.3 million short tons (MMst) and importing 9.8 MMst. U.S. coal exports fell for the fourth consecutive year, down 13.7 MMst from 2015, with 2016 exports less than half of the record volume of coal exported in 2012 (125.7 MMst). Slow growth in world coal demand combined with supplier competition were the primary factors contributing to the decline in U.S. coal exports.
U.S. coal exports declined through most of 2016 despite mid-year increases in international coal prices. Lower mining costs, cheaper transportation costs, and favorable exchange rates continue to provide a market advantage to other major coal-exporting countries such as Australia, Indonesia, Colombia, Russia, and South Africa.
Nearly 80% of the coal exported by the United States in 2016 went to 10 countries. Declining exports to 9 of those 10 countries accounted for two-thirds of the total drop in U.S. exports. One of the few increases in 2016 was exports to Brazil, which increased by nearly 0.6 MMst. China and Morocco also received increased amounts of U.S. coal, but continue to absorb only a small fraction of total U.S. coal exports.
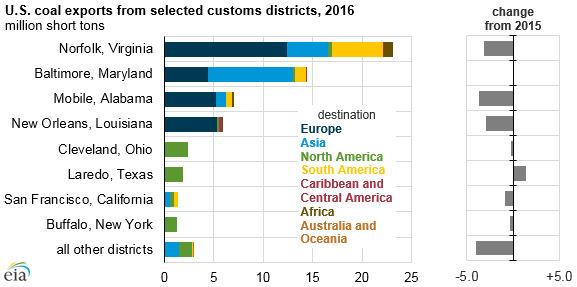
U.S. coal exports are mainly shipped from eight customs districts (ports defined by the U.S. Census Bureau), which accounted for 95% of U.S. coal exports in 2016. Norfolk, Virginia, the largest coal port, shipped 23.1 MMst of coal and accounted for 38% of total U.S. coal exports.
U.S. coal imports totaled 9.8 MMst in 2016, 13% lower than the 11.3 MMst imported in 2015 and the first decline in imports since 2013. The majority (90% in 2016) of coal imported into the United States is steam coal, which is primarily used to generate electricity. Colombia remained the predominant source of U.S. coal imports, despite a decrease of 12% (1.0 MMst) in 2016. Metallurgical coal imports, primarily imported from Canada, fell by 44% (0.8 MMst) in 2016.
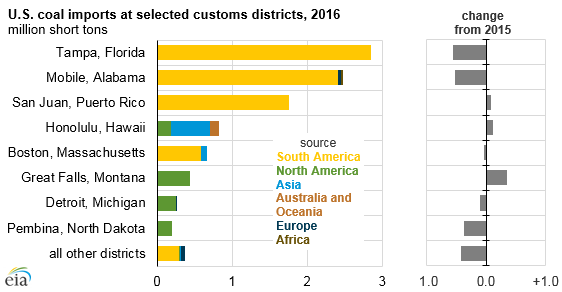
U.S. coal imports are mainly offloaded at a few customs districts, with six districts receiving 90% of U.S. imports in 2016. Tampa, Florida, remained the largest recipient of coal imports in 2016, though imports into Tampa and Mobile, Alabama, declined by 16% (0.6 MMst) and 17% (0.5 MMst), respectively, driven by declines in imports from Colombia. The Great Falls, Montana; Honolulu, Hawaii; and San Juan, Puerto Rico, customs districts were the only ones to see an increase in imports during 2016.
Detailed export and import data by year, country, coal type, and customs district is available through EIA’s Coal Data Browser.
Principal contributor: Elias Johnson
Tags: coal, exports/imports