Menu
Crude oil, gasoline, heating oil, diesel, propane, and other liquids including biofuels and natural gas liquids.
Exploration and reserves, storage, imports and exports, production, prices, sales.
Sales, revenue and prices, power plants, fuel use, stocks, generation, trade, demand & emissions.
Energy use in homes, commercial buildings, manufacturing, and transportation.
Reserves, production, prices, employment and productivity, distribution, stocks, imports and exports.
Includes hydropower, solar, wind, geothermal, biomass and ethanol.
Uranium fuel, nuclear reactors, generation, spent fuel.
Comprehensive data summaries, comparisons, analysis, and projections integrated across all energy sources.
Monthly and yearly energy forecasts, analysis of energy topics, financial analysis, congressional reports.
Financial market analysis and financial data for major energy companies.
Greenhouse gas data, voluntary reporting, electric power plant emissions.
Maps, tools, and resources related to energy disruptions and infrastructure.
State energy information, including overviews, rankings, data, and analyses.
Maps by energy source and topic, includes forecast maps.
International energy information, including overviews, rankings, data, and analyses.
Regional energy information including dashboards, maps, data, and analyses.
Tools to customize searches, view specific data sets, study detailed documentation, and access time-series data.
EIA's free and open data available as API, Excel add-in, bulk files, and widgets
Come test out some of the products still in development and let us know what you think!
EIA's open source code, available on GitHub.
Forms EIA uses to collect energy data including descriptions, links to survey instructions, and additional information.
Sign up for email subscriptions to receive messages about specific EIA products
Subscribe to feeds for updates on EIA products including Today in Energy and What's New.
Short, timely articles with graphics on energy, facts, issues, and trends.
Lesson plans, science fair experiments, field trips, teacher guide, and career corner.
EIA is continuing normal publication schedules and data collection until further notice.
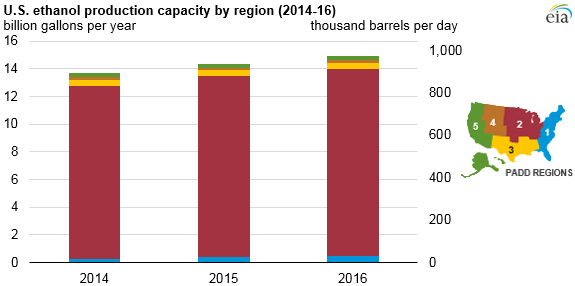
Fuel ethanol production capacity in the United States was nearly 15 billion gallons per year, or 973,000 barrels per day (b/d), at the beginning of 2016, according to EIA's most recent U.S. Fuel Ethanol Plant Production Capacity report. Total capacity of operable ethanol plants increased by more than 500 million gallons per year in January 2016 compared with January 2015.
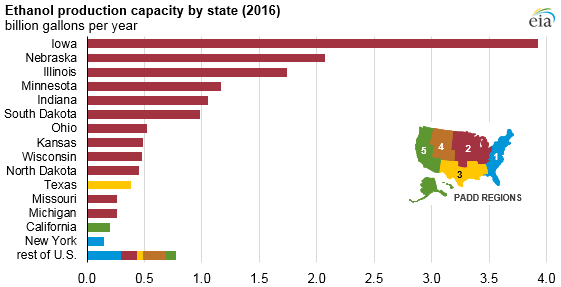
The majority of the 195 ethanol plants, and most of the U.S. fuel ethanol production capacity, are located in the Midwest region (as defined by Petroleum Administration for Defense Districts). Total nameplate capacity in the Midwest was 13.5 billion gallons per year (883,000 b/d), an increase of more than 500 million gallons compared with 2015. Of the top 13 fuel ethanol-producing states, 12 are located in the Midwest.
Actual U.S. production of fuel ethanol reached a total of 14.8 billion gallons (966,000 b/d) in 2015. In EIA's August Short-Term Energy Outlook (STEO), U.S. production of fuel ethanol was forecast to reach 15.1 billion gallons (982,000 b/d) in 2016, equivalent to slightly more than 100% utilization of reported nameplate capacity as of January 1, 2016.
Nameplate production capacity, the measure of capacity that EIA tracks, is the plant manufacturer's stated design capacity to produce denatured (made unfit for human consumption) fuel ethanol during a 12-month period. However, nameplate capacity is not a physical production limit for many ethanol plants.
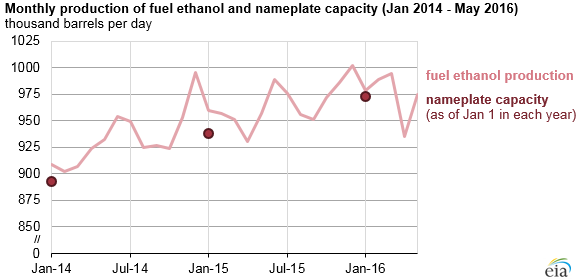
By applying more efficient operating techniques, many ethanol plants are capable of being operated at levels that regularly exceed their nameplate production capacity, if market conditions provide an incentive to do so. This level of operation, called maximum sustainable capacity, is inherently subjective.
Principal contributor: Chris Buckner
Tags: ethanol, production/supply