Menu
Crude oil, gasoline, heating oil, diesel, propane, and other liquids including biofuels and natural gas liquids.
Exploration and reserves, storage, imports and exports, production, prices, sales.
Sales, revenue and prices, power plants, fuel use, stocks, generation, trade, demand & emissions.
Energy use in homes, commercial buildings, manufacturing, and transportation.
Reserves, production, prices, employment and productivity, distribution, stocks, imports and exports.
Includes hydropower, solar, wind, geothermal, biomass and ethanol.
Uranium fuel, nuclear reactors, generation, spent fuel.
Comprehensive data summaries, comparisons, analysis, and projections integrated across all energy sources.
Monthly and yearly energy forecasts, analysis of energy topics, financial analysis, congressional reports.
Financial market analysis and financial data for major energy companies.
Greenhouse gas data, voluntary reporting, electric power plant emissions.
Maps, tools, and resources related to energy disruptions and infrastructure.
State energy information, including overviews, rankings, data, and analyses.
Maps by energy source and topic, includes forecast maps.
International energy information, including overviews, rankings, data, and analyses.
Regional energy information including dashboards, maps, data, and analyses.
Tools to customize searches, view specific data sets, study detailed documentation, and access time-series data.
EIA's free and open data available as API, Excel add-in, bulk files, and widgets
Come test out some of the products still in development and let us know what you think!
EIA's open source code, available on GitHub.
Forms EIA uses to collect energy data including descriptions, links to survey instructions, and additional information.
Sign up for email subscriptions to receive messages about specific EIA products
Subscribe to feeds for updates on EIA products including Today in Energy and What's New.
Short, timely articles with graphics on energy, facts, issues, and trends.
Lesson plans, science fair experiments, field trips, teacher guide, and career corner.
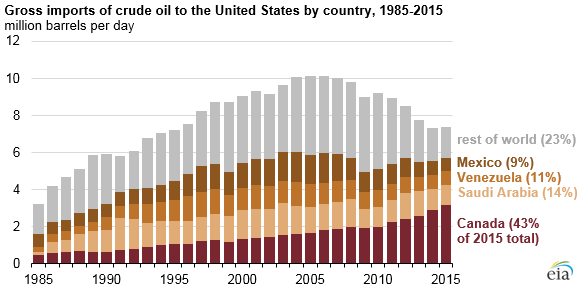
Although total U.S. crude oil imports in 2015 continued to be lower than levels reached during the mid-2000s, imports from the United States' top foreign oil supplier—Canada—were the highest on record, according to annual trade data from EIA's Petroleum Supply Monthly. Canada provided 4 out of every 10 barrels of oil imported into the United States in 2015.
U.S. gross crude oil imports from all sources averaged 7.4 million barrels per day (b/d) in 2015, down 27% since the 2005 high of 10.1 million b/d. As gross crude oil imports decline, a growing share of remaining imports are being sourced from four top suppliers: Canada, Saudi Arabia, Venezuela, and Mexico. Canada, America's largest crude oil supplier since 2004, sent a record-high 3.2 million b/d of gross crude oil exports to the United States in 2015, up 10% from the year before, accounting for a record 43% of total U.S. crude oil imports. Canada also receives nearly all U.S. crude oil exports, making up 422,000 b/d, or 92%, of the 458,000 b/d of crude oil exported from the United States in 2015.
Canada generally produces heavy, sour crude oil that is well-matched to processing capacity in the United States, where many refineries have the equipment needed to process such oil. Canada has few alternative outlets for the heavy crude produced in Alberta, where most of Canada's proved oil reserves are located. Canada is expected to continue to provide a large share of U.S. oil imports for the foreseeable future, especially given the expansion of pipeline and rail shipping capacities to transport Canadian oil.
Principal contributor: Tom Doggett
Tags: Canada, crude oil, exports/imports, liquid fuels, United States