Coal production using mountaintop removal mining decreases by 62% since 2008
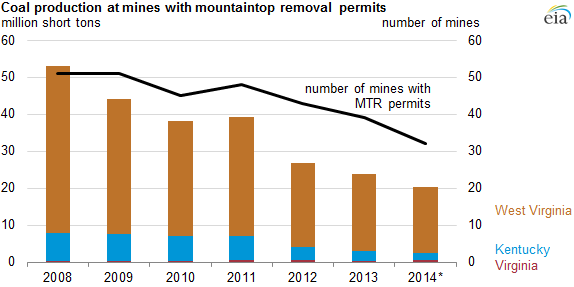
Note: Production excludes refuse coal. Coal production data for 2014 are preliminary.
Coal production from mines with mountaintop removal (MTR) permits has declined since 2008, more than the downward trend in total U.S. coal production. Total U.S. coal production decreased about 15% from 2008 to 2014. Surface production decreased about 21%, and mountaintop removal, one type of surface production, decreased 62% over this period. Lower demand for U.S. coal, primarily used to generate electric power, driven by competitive natural gas prices, increasing use of renewable generation, flat electricity demand, and environmental regulations, has contributed to lower U.S. coal production.
Total U.S. coal production includes both surface and underground mining activity. Types of surface mining techniques include contour strip, area, open pit, and mountaintop removal. In mountaintop removal, entire coal seams running through the upper portion of a mountain are mined by removing all of the overburden (rock or soil overlying a mineral deposit), creating a level plateau or gently rolling contour. This type of mining is sometimes considered a variation of contour mining.
In order to conduct MTR operations, a permit must be granted. By identifying the mines that have MTR permits, it is possible to estimate MTR production using mine production data. However, quantifying the amount of coal produced from mountaintop mining is difficult, because there are a variety of mining techniques that can be performed on a mountaintop in addition to mountaintop removal. These techniques include contour mining, where coal is mined on a hillside, and area mining, where coal is mined from relatively flat terrain. Some of these non-MTR methods may be used in conjunction with or following the use of MTR, making attribution of coal production by mining method less obvious. Consequently, production data in this article refer to total surface production at mines with MTR permits and provide an upper bound of MTR production.
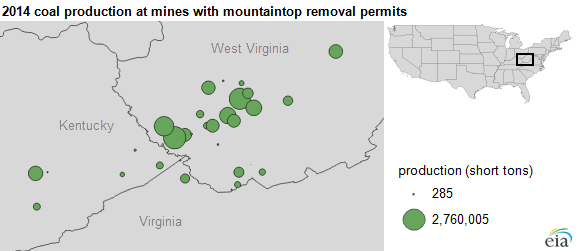
Note: Coal production data for 2014 are preliminary.
MTR is prevalent mostly in Central Appalachia, specifically West Virginia, Kentucky, Virginia, and, in the past, Tennessee. In 2013, Tennessee legislators proposed bills banning permits for specific coal mining operations more than 2,000 feet above sea level. While Tennessee has yet to pass legislation definitively banning MTR operations, there have been no active MTR permits in Tennessee since at least 2007. West Virginia accounts for most domestic MTR production, and MTR production makes up most of the surface production in the state (61% in 2013).
If the mining operation will include a valley fill, which allows the overburden to be deposited in intermittent or perennial streams, an additional permit must be granted. On May 27, 2015, the U.S. Environmental Protection Agency (EPA) and the U.S. Army finalized the Clean Water Rule that more precisely defines waters protected under the Clean Water Act. The Office of Surface Mining Reclamation and Enforcement (OSMRE) is also working with EPA and the U. S. Army Corps of Engineers to develop an environmental impact statement (EIS) analyzing environmental impacts of coal surface mining in the Appalachian region. OSMRE expects to release an EIS along with a proposed stream protection rule this summer.
Principal contributor: JenAlyse Arena