California first state to generate more than 5% of electricity from utility-scale solar
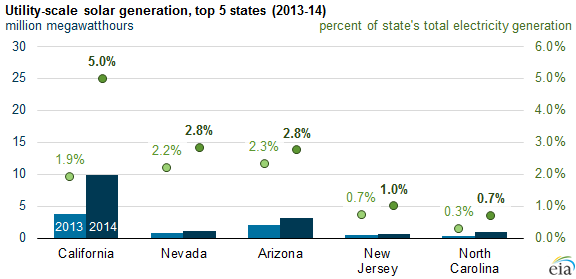
Note: Data include generation from plants greater than 1 megawatt.
California has become the first state with more than 5% of its annual utility-scale electricity generation from utility-scale solar power, according to EIA's Electric Power Monthly. California's utility-scale (1 megawatt (MW) or larger) solar plants generated a record 9.9 million megawatthours (MWh) of electricity in 2014, an increase of 6.1 million MWh from 2013. California's utility-scale solar production in 2014 was more than three times the output of the next-highest state, Arizona, and more than all other states combined.
Several large plants were phased into operation in California during 2014, including two 550 MW solar photovoltaic plants, Topaz and Desert Sunlight (Phases 1 and 2), as well as the 377 MW Ivanpah (Phases 1, 2, and 3) and the 250 MW Genesis solar thermal plants. In total, nearly 1,900 MW of new utility-scale solar capacity was added, bringing the state's utility-scale capacity for all solar technologies to 5,400 MW by the end of 2014.
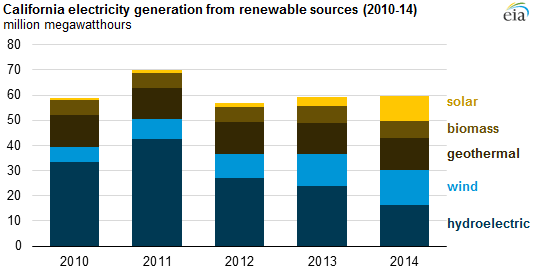
California has promoted solar power through a series of state policies, including a renewable portfolio standard (RPS) that requires electricity providers to obtain 33% of the power they sell from eligible renewable sources by 2020. In 2014, the state obtained 22% of its electricity from nonhydropower renewables including wind, solar, and biomass.
California also created incentives, including rebates and net-metering policies, to encourage rooftop and other small-scale solar capacity, whose generation is not captured in the above figure. By the end of 2014, more than 2,300 MW of small-scale solar capacity was installed on homes and businesses, according to the California Public Utilities Commission.
The top three states in utility-scale solar generation in 2014 were California, Arizona, and Nevada. These states in the southwestern United States have some of the best solar resources in the world. However, states with less-favorable solar resources, such as New Jersey and Massachusetts, also are among the top 10 states in total solar generation. All of the top 10 states—with the exception of Florida—have a renewable portfolio standard in place. Most of those policies include a specific target for solar power or customer-sited generation.
Note: Data include generation from plants greater than 1 megawatt.
The increase in California's solar production came the same year that drought conditions caused hydroelectric generation to fall 46% compared to the previous five-year average. Although solar is only available at certain times of the day, the annual increase in California's solar generation in 2014 offset 83% of the decrease in hydroelectric generation. Along with increases in generation from wind power and geothermal energy, solar power helped make California the top state producer of nonhydroelectric renewable electricity in 2014, narrowly topping Texas.
Principal contributor: Allen McFarland