
U.S. crude oil storage capacity utilization now up to 60%
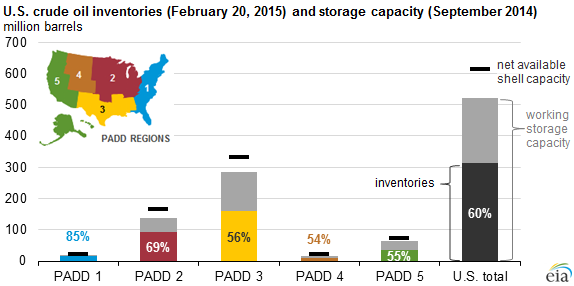
Note: Inventories shown in the graph do not include pipeline fill, lease stocks, or oil in transit from Alaska. PADD is the Petroleum Administration for Defense District.
Crude oil inventory data for the week ending February 20 show that total utilization of crude oil storage capacity in the United States stands at approximately 60%, compared with 48% at the same time last year. Most U.S. crude oil stocks are held in the Midwest and Gulf Coast, where storage tanks were at 69% and 56% of capacity, respectively, as of February 20. This capacity use calculation reflects only crude oil stored in tanks or underground caverns at tank farms and refineries, and excludes some crude oil that is included in commercial inventory data, such as pipeline fill and lease stocks held in production areas.
Capacity is about 67% full in Cushing, Oklahoma (the delivery point for West Texas Intermediate futures contracts), compared with 50% at this point last year. Working capacity in Cushing alone is about 71 million barrels, or more than half of all Midwest (as defined by Petroleum Administration for Defense District 2) working capacity and about 14% of the national total.
EIA releases a report twice a year detailing crude oil and product storage capacity in the United States; this report describes two measures of capacity.
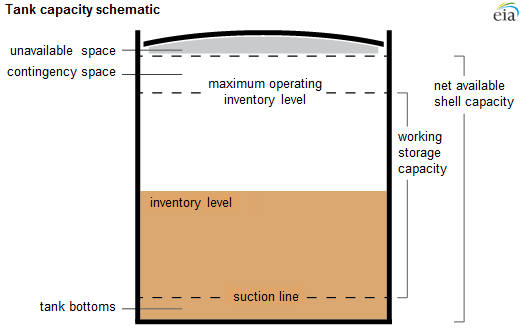
Net available shell capacity includes tank bottoms, working storage capacity, and contingency space (see figure below). Tank bottoms are volumes below the normal suction lines of a storage tank that may include water and sediment and are difficult to access. Contingency space is space above the maximum operating inventory level that remains empty during normal operations. This contingency space allows flexibility to exceed working storage capacity without creating safety hazards or operational disruptions.
Working storage capacity, which excludes contingency space and tank bottoms, is perhaps a more useful measure of capacity. From September 2013 to September 2014, total crude oil working storage capacity increased from 502 million barrels to 521 million barrels. Operation of crude oil storage and transportation systems requires some amount of working storage to be available to be filled at all times in order to receive deliveries by pipeline, tanker, barge, and rail. Therefore, it is not possible to completely fill all the working storage capacity reported by EIA for the United States and PADD regions. The exact amount of storage capacity that must be available to maintain operation of crude oil storage and transportation systems is unknown.
The storage utilization rates reported above reflect crude oil inventories stored in tanks or in underground caverns at tank farms and refineries as a percentage of working storage capacity. Simply dividing the total commercial crude inventory by the working capacity can lead to overestimates of storage capacity utilization, because some inventory data include crude oil that is not truly in stored in tankage, such as:
- Pipeline fill, or oil that is being transported by pipeline
- Lease stocks, or oil that has been produced but not yet put into the primary supply chain
- Crude oil on ships in transit from Alaska
As reported in the Weekly Petroleum Status Report, EIA crude oil inventory data include estimates for pipeline fill, lease stocks, and crude in transit from Alaska. Subtracting those volumes removes about 120 million barrels from the larger definition of crude oil inventories, or almost 30% of the national total. Even with these adjustments to inventory, the estimates of working storage capacity utilization provided above are slightly overstated because estimates are not available for volumes in floating storage, tank bottoms, and oil on rail or barges.
Principal contributors: Alex Wood, Hannah Breul