Higher RIN prices support continued ethanol blending despite lower gasoline prices
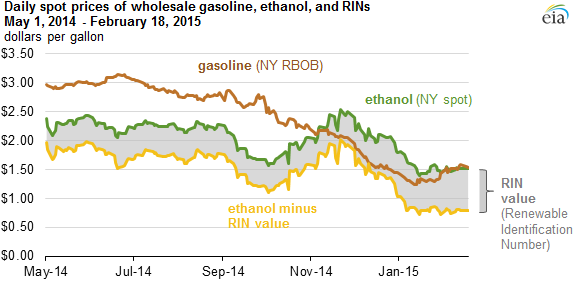
Note: RBOB is reformulated blendstock for oxygenate blending.
With the exception of two short periods in late 2013 and the first quarter of 2014, when winter-related logistical bottlenecks drove up ethanol prices, spot ethanol prices have consistently been lower than gasoline prices from December 2011 through October 2014. However, with the sharp decline in crude oil and gasoline prices in the latter months of 2014, gasoline spot prices fell below ethanol spot prices in early November. For most of December through mid-January, ethanol was priced about 30 cents per gallon more than wholesale gasoline; since that time, the gap between the spot prices of ethanol and gasoline has narrowed.
In considering how the relationship between ethanol and gasoline prices affects the incentive to blend ethanol into gasoline, it is important to take account of the value of Renewable Identification Numbers (RINs) associated with each gallon of ethanol that is blended into gasoline. RINs were introduced as a compliance mechanism for the Renewable Fuel Standard (RFS) program administered by the Environmental Protection Agency (EPA) under laws enacted in 2005 and 2007. There are several types of RINs that can be used to demonstrate compliance with goals established for different categories of renewable fuels by the RFS program. In recent years, the D6 RIN, primarily generated via corn ethanol production, has increased in value during times of higher RFS target announcements or impending compliance deadlines.
The recent increase in the D6 RIN price, shown as the difference between the green and yellow lines in the graph, appears to be driven at least in part by the decline in gasoline prices. When the economics for ethanol blending may seem to be unfavorable based on spot prices, a higher RIN value reduces the "net of RIN" cost of ethanol blending. This affects blenders' RFS compliance choices between the options of purchasing ethanol RINs and blending ethanol, which under the RFS program separates the RINs attached to the blended ethanol gallons, enabling their use for RFS compliance either directly or through sale to another obligated party under the RFS program.
Blending decisions also reflect other factors, notably the need to produce fuels that meet specifications. Ethanol has an octane rating of approximately 113, well above the range of 87 to 93 octane for retail gasoline at the pump. For this reason, ethanol provides an octane boost to blended gasoline, which allows some refiners and blenders to blend ethanol with cheaper sub-octane blendstocks to create finished gasoline, which can bolster blending margins.
Over the past few years, ethanol has sold at prices roughly 10% lower than the price of wholesale gasoline, which combined with positive RIN values and the value of octane encourages refiners and blenders to blend ethanol with gasoline. In most cases, ethanol is blended into gasoline up to 10% by volume. This percentage is the maximum blend approved for use in all gasoline-powered vehicles by EPA and is also accepted by all manufacturers as a fuel that does not risk the voiding of vehicle warranties.
As ethanol prices rose to a $0.25/gal-to-$0.30/gal premium over gasoline in December and January, prices for the 2014 D6 ethanol RIN, which can be used for RFS compliance in either 2014 or 2015, increased by roughly the same amount, from about $0.45/gal in November to $0.71/gal in mid-January. This increase in the RIN value reduces the effective price of ethanol and supports ethanol blending despite the unfavorable spot ethanol pricing.
Current RIN values may also be affected by uncertainty regarding requirements that EPA might ultimately promulgate for the 2014 and 2015 RFS program years. EPA has yet to promulgate a rule setting the number of RINs that obligated parties will need to cover their RFS obligation for sales made in 2014. EPA has also not proposed, let alone promulgated, rules for the 2015 RFS program year, which by law were to be issued in November, two months prior to the start of the program year. The uncertainty surrounding the finalization of RFS targets for 2014 and 2015, together with the gasoline blending economics discussed above, may also be contributing to recent RIN price developments.
Principal contributor: Sean Hill