
Wholesale power prices increase across the country in 2014
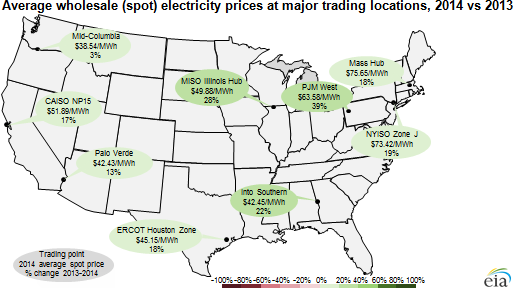
Wholesale on-peak electricity prices were up at trading hubs across the nation between 2013 and 2014, driven largely by increases in spot natural gas prices and high energy demand caused by cold weather in the beginning of the year.
Electricity prices were highest in the Northeast, driven by record-high natural gas prices early in the year during a very cold winter. Spot natural gas prices at the Henry Hub averaged $4.38 per million British thermal units (MMBtu) in 2014, an increase of 17% from 2013, and prices at other major trading points were up 16%-40% in 2014. Electricity prices were the lowest, and increased the least (only 3%), in the Pacific Northwest, where abundant low-cost hydroelectric generation often leads to the lowest prices in the nation.
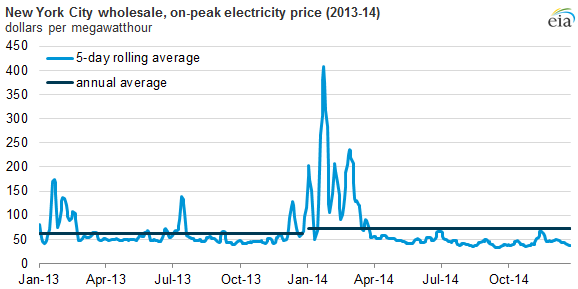
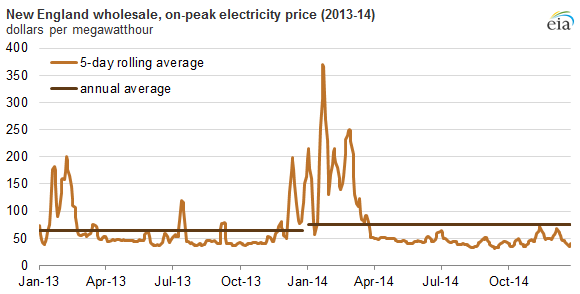
A major factor for electricity prices in 2014 was the extreme weather system that covered much of the United States, resulting in heavy snowfall and bitterly cold temperatures during the winter of 2013-14, which strained the energy grid in several ways.
Source: U.S. Energy Information Administration, based on SNL Energy
Note: Price data are for NYISO Zone J day ahead, on peak power price.
Source: U.S. Energy Information Administration, based on SNL Energy
Note: Price data are for Massachusetts Hub day-ahead, on-peak power price.
On many days natural gas pipelines filled to capacity, leading to record-high wholesale natural gas prices at several locations. Spot natural gas prices reached $120/MMBtu in New York City (up from a 2013 high of $36/MMBtu), $78/MMBtu in Boston (up from a 2013 high of $34/MMBtu), and $34/MMBtu in Chicago (up from a 2013 high of $5/MMBtu). Spot wholesale electricity prices—which in many markets are largely determined by the spot price of gas sold to natural gas-fired generators—spiked in turn. Peak hourly spot electricity prices exceeded $518/MWh in New York City, $467/MWh in New England, and $190/MWh in Northern Illinois.
Petroleum use for electric generation spiked last winter, after trending down significantly over the past decade. In January, more than 10 million barrels of petroleum products were used to generate electricity, the highest since February 2007 and nearly three times more than the previous January. Petroleum generators are rarely called upon to produce electricity, and are usually done so in cases of extreme peak demand, for temporary grid stability, or on the rare occasion where oil is an economic substitute for extremely high-priced natural gas.
The severe weather in winter 2013-14 slowed coal deliveries, resulting in shrinking power plant coal stockpiles that at some generators in the Midwest fell to uncomfortably low levels. Problems with rail deliveries of coal continued into 2014, in part because competition for rail capacity from other traffic, including grain and oil shipments, led to renewed concerns about the adequacy of coal inventories in fourth-quarter 2014. In response, power plant operators purchased electricity from the wholesale market, reduced output at select facilities, and in a few cases moved coal by truck instead of rail in order to manage stockpiles.
The coal inventory situation improved toward the end of the year, as total U.S. coal stockpile levels increased nearly 10% from September to October, the largest percentage monthly build in at least five years. Coal railcar loadings, a leading indicator of coal stockpile activity, were the highest for the year in consecutive weeks in December and were considerably higher than in December 2013. However, the process of rebuilding stockpiles is expected to be slow, continuing into 2015 and possibly 2016.
The summer, often a time of stress in power markets because of hot weather and high demand, was relatively quiet in 2014. Daily peak loads were significantly lower than all-time peak loads in all regions except Texas (ERCOT), where a peak load of 66,725 megawatts (MW) on August 25 approached the 68,305 MW all-time peak set in August 2011.
Principal contributor: Tim Shear
Tags: coal, electricity, inventories/stocks, map, natural gas, New England, New York, prices