Summer average gasoline price expected to be close to last year's level
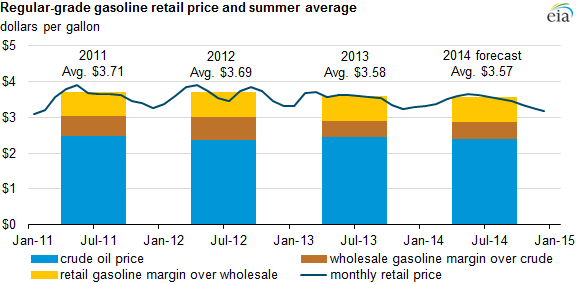
Drivers are expected to pay an average $3.57 per gallon for regular gasoline this summer, close to last year's level, according to the U.S. Energy Information Administration's April Short-Term Energy and Summer Fuels Outlook.
The price for Brent crude oil—which typically accounts for about two-thirds of the retail price of gasoline—is expected to average $105 per barrel this summer driving season (April through September), which is about $2 below its level last summer. However, the benefit of lower crude oil prices is expected to be almost fully offset by higher wholesale margins compared to last summer, although expected wholesale margins remain below their levels during the 2011 and 2012 summers.
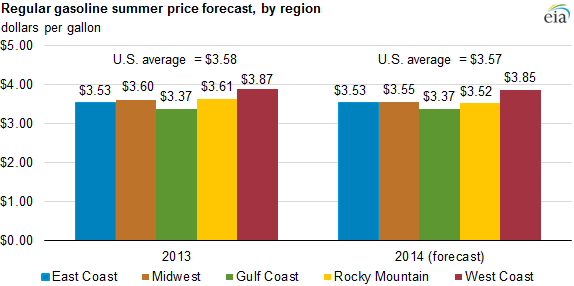
This summer's monthly average gasoline price is expected to peak at $3.66 per gallon in May and then steadily decline to $3.46 in September. Gasoline prices vary by region, with the West Coast average price expected to be as much as 48 cents per gallon higher than the Gulf Coast price. Excluding the West Coast, the differences in average gasoline prices for each of the other four main U.S. regions—East Coast, Midwest, Gulf Coast, and Rocky Mountain—are forecast to be smaller this summer compared to last year.
Other highlights of EIA's summer gasoline market forecast are:
- Gasoline consumption is expected to average almost 9 million barrels per day (bbl/d), close to last summer's level.
- A 0.7% rise in highway travel is nearly offset by improvements in vehicle fuel efficiency.
- Gasoline stocks at the April 1 start of the driving season are roughly 10 million barrels lower than a year ago and 6 million barrels below the five-year average.
- Refinery gasoline production, including blendstock output, is expected to increase 60,000 bbl/d from last summer to almost 7.9 million bbl/d.
- Fuel ethanol blending into gasoline is expected to decrease by 3,000 bbl/d to 870,000 bbl/d, which is 9.7% of total gasoline consumption.
- Total net gasoline imports are expected to average 240,000 bbl/d, down 18,000 bbl/d from last summer.
Principal contributor: Tom Doggett