The South anchors growth in use of electricity for air conditioning since 1993
Republished August 15, 2013, 10:40 a.m. to add content.
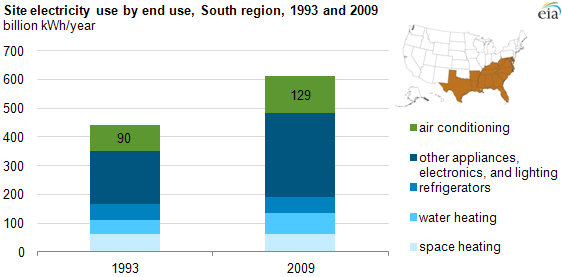
Over the past 20 years, the use of air conditioning has increased in all regions of the United States, but this increase has been most pronounced in the South Census region. Since 1993, electricity consumed for air conditioning in the South has increased 43% and now accounts for 21% of all electricity consumption in the region. Nationally, electricity consumed for air conditioning has increased 39% since 1993, but only accounts for 14% of all electricity consumed. Several factors are responsible for this increase, including population growth, increased use of air conditioning, especially central air conditioning, and larger home size.
Between 1993 and 2009, the South added the most housing units, up 8.6 million units. Air conditioning has been widespread throughout most of the South for many years, but many households in the South have shifted from room air conditioning to central air conditioning. In 1993, when 89% of households in the South used air conditioning, only 65% of households used central air conditioning while 27% used room air conditioning (window or wall units). By 2009, 96% of households in the South used air conditioning and 82% of households used central air conditioning, while only 15% of households used room air conditioning (1% of households used both central and room air conditioning in 2009, down from 3% in 1993).
Central air conditioners often consume more energy because they cool more of the area within a home. In 2009, homes in the South with central systems used an average of 3,382 kilowatthours per year (kWh/year) for air conditioning, while homes in the South that used room units only used an average of 1,882 kWh/year for air conditioning.
Home size in the United States has increased over the past 20 years, and home size in the South has grown faster than the country as a whole. The average home in the United States is now 5% larger than it was in 1993, and the average home in the South is 9% larger. The average home built in the South between 2000 and 2009 is 11% larger than one built in the 1990s, and 42% larger than one built in the 1980s. The increase in cooled area has increased at roughly the same rate (14% and 50%, respectively) since almost all new homes in the South have central air conditioning. Homes in the South are also more likely to have central air conditioning than homes in any other region.
There are differences in the income characteristics of households that use air conditioning, both in the number of households without any air conditioning and the households that use only room air conditioning. In the South, 8% of households with incomes in the lowest income categories do not use air conditioning and 25% use only room air conditioning. By contrast, only 1% of households with incomes in the highest income categories do not use air conditioning and only 3% use only room air conditioning. So although most households in the South use central air conditioning, the households not using it are largely those in the lowest income categories.
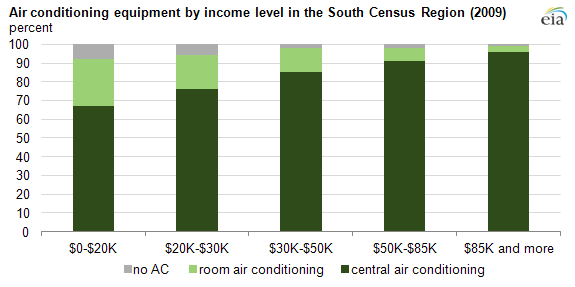
Note: A small percentage of households with central air conditioning also use room air conditioning.