
U.S. natural gas generation in 2021 sees its first year-over-year decline in three years
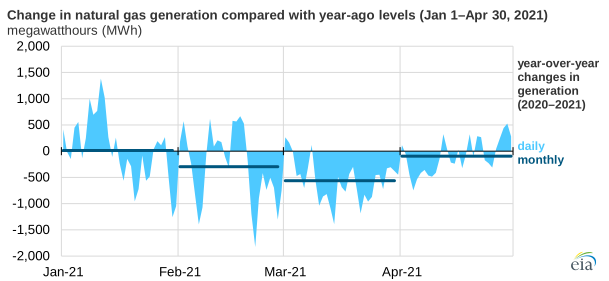
In the first four months of 2021, natural gas-fired generation in the Lower 48 states averaged 3,394 gigawatthours (GWh) per day, a nearly 7% decrease from the same period in 2020, according to data from our Hourly Electric Grid Monitor. The decline in natural gas generation during the first four months of this year is the result of higher natural gas prices and increased competition from renewables, and it is the first year-over-year decline since 2017. Overall, U.S. electricity generation during the period increased 6.6% compared with 2020 because of colder winter weather.
Natural gas-fired generation has been facing increased competition from renewable generation in the United States because of recent record-high capacity additions to wind and solar power plants. Between May 2020 and February 2021 (the most recent month for which we have data), 22.5 gigawatts (GW) of combined net wind and solar electric generating capacity additions came online in the United States, a 15% increase. We expect an additional 28.7 GW of wind and solar capacity to enter service during the remainder of 2021, based on our latest Preliminary Monthly Electric Generator Inventory. In contrast, between May 2020 and February 2021, 4.8 GW of U.S. natural gas capacity came online, a 1% increase. We expect an additional 3.8 GW of natural gas capacity to come online during the remainder of 2021.
U.S. natural gas prices have risen since April 2020 because of lower natural gas production and higher winter heating demand compared with the previous winter heating season that ran from October 2020 to March 2021. The U.S. benchmark natural gas price at the Henry Hub averaged $2.83 per million British thermal units (MMBtu) from January through April 2021, despite a cold snap and record-high prices in mid-February. Higher U.S. natural gas prices have made natural gas-fired generation relatively less competitive compared with coal-fired generation, prompting natural gas-to-coal fuel switching. Coal-fired generation has increased nearly 40% in the United States during the first four months of 2021 compared with the same period in 2020 and accounts for 23% of total generation, according to our recent Hourly Electric Grid Monitor data.
We expect declines in natural gas-fired generation to continue through 2022. In May’s Short-Term Energy Outlook, we forecast natural gas-fired generation will decline 9.1% in 2021 and a further 0.7% in 2022.
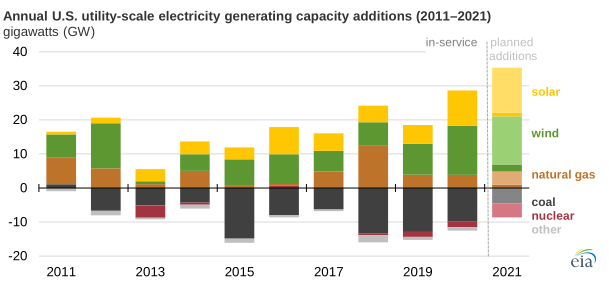
Note: Data for 2021 include net additions through February 2021. Planned additions for the remainder of the year are shaded lighter.
Principal contributor: Stephen York
Tags: generation, electricity, natural gas