
Ohio's fuel mix for power generation is changing
Notes: 2011 data through September. The CEMS data includes information for fossil fuel-fired and nuclear generators that are 25 megawatts or greater.
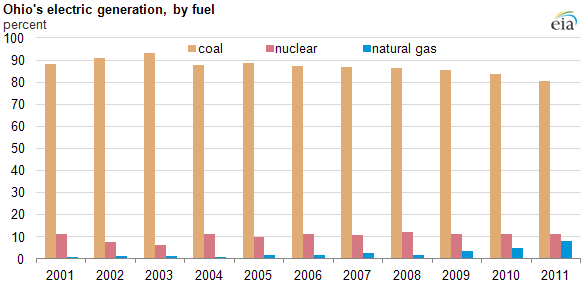
Although coal remains the dominant fuel for Ohio's electric power generation, accounting for 81% of total statewide generation during the first 9 months of 2011, the amount of natural gas-fired electric generation in Ohio is up markedly over the past decade (see chart above). Natural gas fueled 8% of Ohio's total generation during the first 9 months of 2011, up from only 1% during the 2001-2004 period.
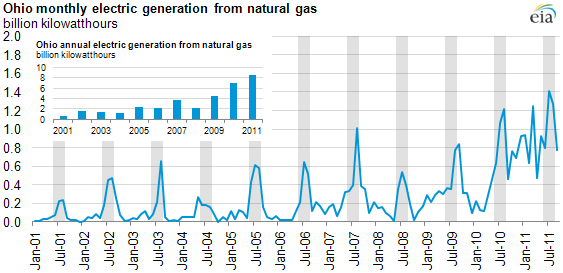
Average monthly natural gas-fired generation in Ohio in 2011 is similar to prior summer peak levels. The average monthly generation of 941,000 MWh in 2011 (through September) was higher than any monthly peak in the preceding decade except for August 2007 and July and August of 2010, although these levels are still considerably lower than coal-fired generation in the state.
Growth in Ohio's natural gas generation, much like recent generation trends in Pennsylvania, has come partly at the expense of coal generation. The share of coal generation, while still the dominant source of electricity generation in Ohio, fell for six consecutive years between 2005 and 2011, dropping from 89% to 81% of total statewide electric generation.
Notes: 2011 data through September. The CEMS data includes information for fossil fuel-fired and nuclear generators that are 25 megawatts or greater. Summer months (June-August) are shaded.
Three factors likely underpin increased natural gas generation in Ohio.
- Natural gas production increases and infrastructure additions. Domestic natural gas production increased rapidly over the past several years, with much of the increase located in the Marcellus shale region in or near eastern Ohio. Also, the introduction of the Rockies Express Pipeline in 2009 brought a significant amount of lower-cost gas from the Rockies directly into Ohio.
- Changes in relative fuel prices. Prices of coal and natural gas are key input costs at electric power plants in Ohio and have taken different trajectories in the last couple of years. Between 2009 and 2011 the yearly average of the NYMEX prompt-month futures price for Central Appalachian coal rose about 52%. Over that same period, prompt-month natural gas futures prices at Henry Hub declined 3%.
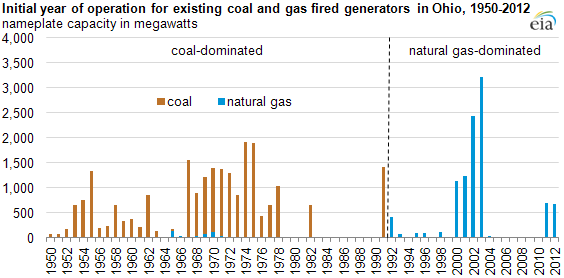
- Changes in composition of generating capacity mix. Ohio coal and natural gas generators were constructed in two fairly distinct waves. Nearly all of the existing coal-fired generators were built before 1992, while nearly all of the natural gas-fired generators were built after 1992, with newer natural gas generators achieving greater operational efficiencies than the older coal generators.
Tags: capacity, coal, electricity, generation, Marcellus, natural gas, nuclear, Ohio, production/supply, shale, states