
U.S. gasoline prices this Thanksgiving are the lowest since 2009
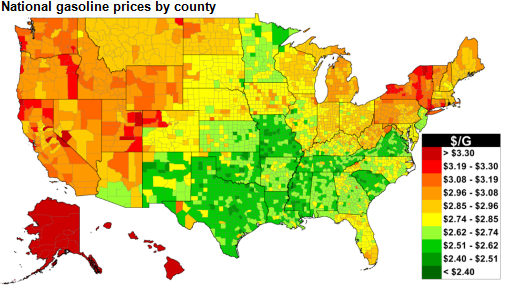
U.S. retail regular-grade gasoline prices continue to decline, averaging $2.82 per gallon (gal) as of November 24. This average is 47 cents lower than a year ago, and the lowest price heading into a Thanksgiving holiday since 2009. Traditionally, the Thanksgiving holiday is one of the most traveled times of the year in the United States, and much of that travel is by car. AAA estimates that during this Thanksgiving holiday weekend (November 26-30), 41.3 million people in the United States will travel more than 50 miles from home by car. This level of travel, 4.3% higher than the same time last year, is the highest number of travelers by car for Thanksgiving in seven years and the third highest since AAA began publishing the data in 2000.
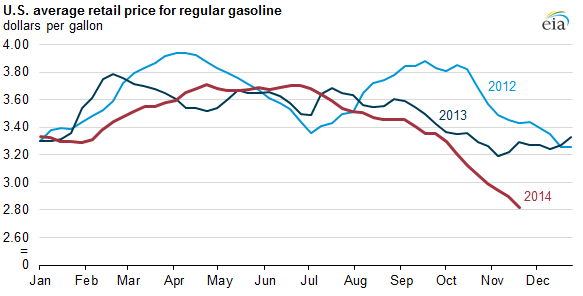
Gasoline prices across the country reflect differences in gasoline quality, taxes, and the characteristics of regional market supply and demand balances. West Coast prices typically exceed the U.S. average because of stricter fuel specifications in California and the region's isolation from other domestic markets. Regional differences in gasoline prices are also attributable to variations in state and local taxes and differences in regional supply costs.
Much of the decline in gasoline prices since mid-2014 is attributable to falling crude oil prices. The combination of robust U.S. crude oil production growth, a return of Libyan production (despite recent setbacks), weakening expectations for the global economy (particularly in China), and seasonally low refinery demand has reduced oil prices. North Sea Brent spot prices have fallen from a July monthly average of $112 per barrel (bbl) to a November monthly average of $80/bbl (through November 24). The average U.S. retail regular-grade gasoline price has fallen 88 cents/gal since the start of July.
EIA's November 2014 Short-Term Energy Outlook (STEO) projects the U.S. average retail price of regular gasoline will continue to decline for the remainder of the year and will average $2.80/gal in December. The STEO forecast of annual average U.S. regular gasoline retail prices is $3.39/gal in 2014 and $2.94/gal in 2015, well below the $3.51/gal price in 2013. However, as discussed in the STEO, the current value of futures and options contracts implies a wide confidence interval for forecasts of crude oil, which is the main determinant for gasoline prices.
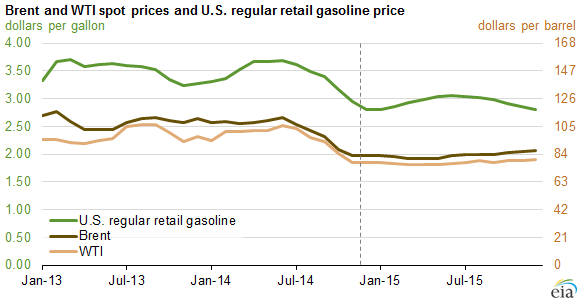
Note: Dollars per barrel calculated using conversion rate of 1 barrel = 42 gallons. WTI is West Texas Intermediate
Principal contributor: Hannah Breul