
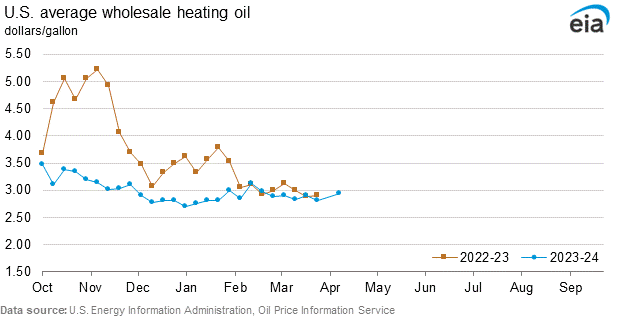
Weekly heating oil and propane prices are only collected during the heating season, which extends from October through March.
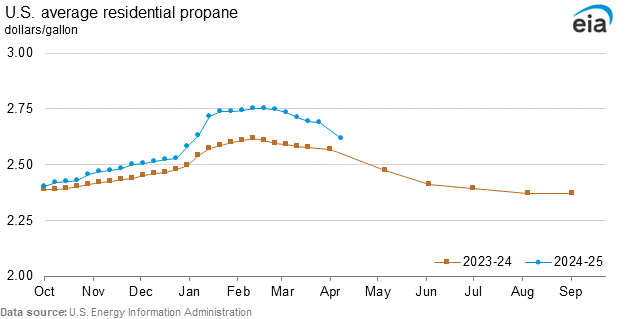
| change from | |||
|---|---|---|---|
| 11/02/26 | week ago | year ago | |
| U.S. Average | 2.820 | 0.089 | 0.375 |
| East Coast (PADD 1) | 3.814 | 0.075 | 0.464 |
 New England (PADD 1A) |
3.978 | 0.066 | 0.538 |
| Connecticut | 4.448 | 0.137 | 0.721 |
| Maine | 3.691 | 0.012 | 0.546 |
| Massachusetts | 3.812 | 0.095 | 0.423 |
| New Hampshire | 3.960 | 0.056 | 0.531 |
| Rhode Island | 4.141 | 0.025 | 0.614 |
| Vermont | 3.941 | 0.038 | 0.449 |
| Central Atlantic (PADD 1B) |
3.707 | 0.066 | 0.447 |
| Delaware | 3.938 | 0.130 | 0.467 |
| Maryland | 3.933 | 0.074 | 0.396 |
| New Jersey | 4.138 | 0.041 | 0.623 |
| New York | 3.837 | 0.043 | 0.418 |
| Pennsylvania | 3.310 | 0.093 | 0.467 |
| Lower Atlantic (PADD 1C) |
3.792 | 0.092 | 0.410 |
| Florida | 5.149 | 0.177 | 0.487 |
| Georgia | 3.364 | 0.085 | 0.392 |
| North Carolina | 3.739 | 0.099 | 0.386 |
| Virginia | 3.860 | 0.065 | 0.447 |
| Midwest (PADD 2) |
2.298 | 0.098 | 0.358 |
| Illinois | 1.995 | 0.047 | 0.265 |
| Indiana | 2.723 | 0.093 | 0.465 |
| Iowa | 1.859 | 0.113 | 0.316 |
| Kansas | 2.264 | 0.164 | 0.440 |
| Kentucky | 2.896 | 0.060 | 0.422 |
| Michigan | 2.531 | 0.068 | 0.367 |
| Minnesota | 2.198 | 0.148 | 0.371 |
| Missouri | 2.305 | 0.071 | 0.340 |
| Nebraska | 1.901 | 0.076 | 0.309 |
| North Dakota | 1.838 | 0.093 | 0.278 |
| Ohio | 2.805 | 0.106 | 0.394 |
| Oklahoma | 2.461 | 0.078 | 0.281 |
| South Dakota | 2.016 | 0.065 | 0.326 |
| Tennessee | 3.345 | 0.078 | 0.292 |
| Wisconsin | 2.165 | 0.158 | 0.423 |
| Gulf Coast (PADD 3) |
3.074 | 0.046 | 0.221 |
| Alabama | 3.688 | 0.058 | 0.243 |
| Arkansas | 2.558 | 0.081 | 0.306 |
| Mississippi | 3.167 | 0.018 | 0.183 |
| Texas | 3.216 | 0.036 | 0.287 |
| Rocky Mountain (PADD 4) |
2.485 | 0.108 | 0.397 |
| Colorado | 2.438 | 0.066 | 0.334 |
| Idaho | 2.902 | 0.216 | 0.590 |
| Montana | 2.280 | 0.101 | 0.385 |
| Utah | 2.596 | 0.131 | 0.348 |
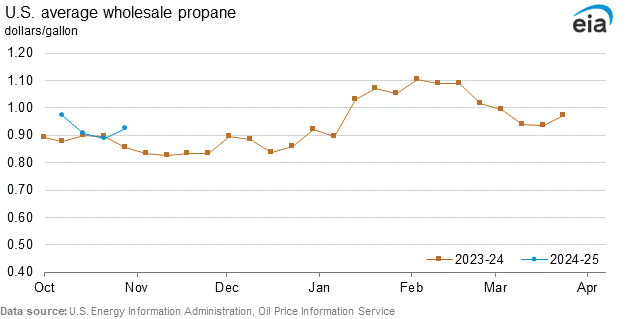
| change from | |||
|---|---|---|---|
| 11/02/26 | week ago | year ago | |
| U.S. Average | 1.440 | 0.149 | 0.606 |
| East Coast (PADD 1) | 1.533 | 0.161 | 0.606 |
| Central Atlantic (PADD 1B) |
1.592 | 0.162 | 0.611 |
| Maryland | 1.649 | 0.167 | 0.658 |
| New Jersey | 1.310 | 0.090 | 0.400 |
| New York | 1.638 | 0.169 | 0.626 |
| Pennsylvania | 1.582 | 0.166 | 0.620 |
| Lower Atlantic (PADD 1C) |
1.446 | 0.160 | 0.599 |
| Georgia | 1.371 | 0.158 | 0.583 |
| North Carolina | 1.393 | 0.158 | 0.584 |
| Virginia | 1.614 | 0.168 | 0.641 |
| Midwest (PADD 2) |
1.400 | 0.137 | 0.607 |
| Illinois | 1.321 | 0.102 | 0.571 |
| Indiana | 1.415 | 0.137 | 0.581 |
| Iowa | 1.351 | 0.127 | 0.600 |
| Kansas | 1.278 | 0.127 | 0.600 |
| Kentucky | NA | NA | NA |
| Michigan | 1.417 | 0.134 | 0.627 |
| Minnesota | 1.388 | 0.123 | 0.585 |
| Missouri | 1.368 | 0.116 | 0.608 |
| Nebraska | 1.321 | 0.127 | 0.601 |
| North Dakota | 1.311 | 0.137 | 0.570 |
| Ohio | 1.627 | 0.260 | 0.714 |
| Oklahoma | 1.367 | 0.124 | 0.615 |
| South Dakota | 1.342 | 0.129 | 0.606 |
| Tennessee | 1.636 | 0.170 | 0.646 |
| Wisconsin | 1.419 | 0.124 | 0.601 |
| Gulf Coast (PADD 3) |
1.402 | 0.185 | 0.575 |
| Alabama | 1.348 | 0.158 | 0.583 |
| Arkansas | NA | NA | NA |
| Mississippi | 1.298 | 0.168 | 0.595 |
| Texas | 1.490 | 0.207 | 0.559 |
| Rocky Mountain (PADD 4) |
1.420 | 0.191 | 0.657 |
| Colorado | 1.420 | 0.191 | 0.657 |
| Note: Price in dollars per gallon, excluding taxes. Values shown on the graph and corresponding data pages for the previous week may be revised to account for late submissions and corrections. | |||
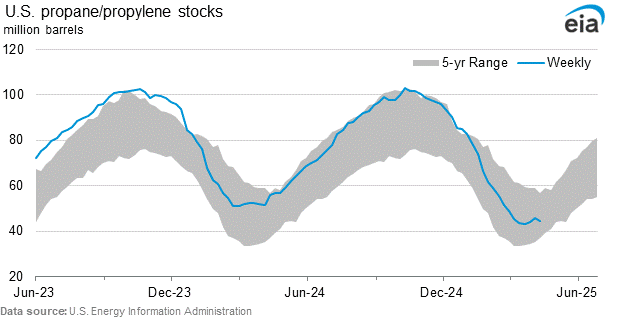
| change from | |||
|---|---|---|---|
| 10/30/26 | week ago | year ago | |
| Stocks | 104.108 | -1.628 | -1.987 |
| Production | 2.948 | 0.054 | 0.096 |
| Demand | 1.440 | 0.680 | 0.496 |
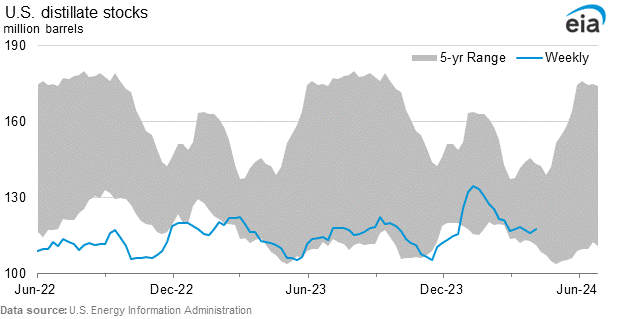
| Note: Stocks in millions of barrels. Production and Demand in millions of barrels per day.
*Demand = Product Supplied; approximately represents consumption of petroleum products because it measures the disappearance of these products from primary sources. |
|||
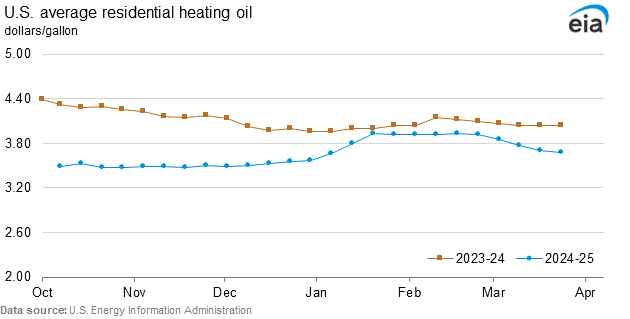
| change from | |||
|---|---|---|---|
| 11/02/26 | week ago | year ago | |
| U.S. Average | 6.138 | -0.092 | 2.506 |
| East Coast (PADD 1) | 6.136 | -0.095 | 2.496 |
| New England (PADD 1A) |
6.073 | -0.091 | 2.525 |
| Connecticut | 5.991 | -0.153 | 2.419 |
| Maine | 5.984 | -0.056 | 2.692 |
| Massachusetts | 6.176 | -0.078 | 2.546 |
| New Hampshire | 6.056 | -0.012 | 2.560 |
| Rhode Island | 6.205 | -0.191 | 2.440 |
| Vermont | 6.071 | -0.024 | 2.580 |
| Central Atlantic (PADD 1B) |
6.206 | -0.105 | 2.470 |
| Delaware | 6.413 | -0.022 | 2.434 |
| Dist Columbia | NA | NA | NA |
| Maryland | 6.360 | -0.065 | 2.581 |
| New Jersey | 6.305 | -0.076 | 2.437 |
| New York | 6.324 | -0.108 | 2.387 |
| Pennsylvania | 5.927 | -0.122 | 2.587 |
| Lower Atlantic (PADD 1C) |
5.967 | 0.012 | 2.489 |
| North Carolina | 5.872 | 0.031 | 2.594 |
| Virginia | 6.039 | -0.001 | 2.408 |
| Midwest (PADD 2) |
6.183 | -0.037 | 2.705 |
| Indiana | 6.451 | -0.029 | 2.906 |
| Iowa | 5.795 | -0.096 | 2.576 |
| Kentucky | 5.918 | 0.046 | 2.785 |
| Michigan | 6.204 | 0.011 | 2.926 |
| Minnesota | 5.842 | -0.106 | 2.234 |
| Nebraska | 5.652 | -0.072 | 2.737 |
| Ohio | 6.414 | 0.015 | 2.752 |
| Wisconsin | 6.038 | -0.102 | 2.765 |
| change from | |||
|---|---|---|---|
| 11/02/26 | week ago | year ago | |
| U.S. Average | 5.100 | -0.218 | 2.513 |
| East Coast (PADD 1) | 5.099 | -0.219 | 2.512 |
| New England (PADD 1A) |
5.092 | -0.235 | 2.498 |
| Connecticut | 5.047 | -0.232 | 2.477 |
| Maine | 5.100 | -0.235 | 2.503 |
| Massachusetts | 5.085 | -0.225 | 2.503 |
| New Hampshire | 5.013 | -0.308 | 2.468 |
| Rhode Island | 5.009 | -0.236 | 2.460 |
| Vermont | 5.498 | -0.149 | 2.641 |
| Central Atlantic (PADD 1B) |
5.106 | -0.206 | 2.523 |
| Delaware | 5.143 | -0.220 | 2.262 |
| Maryland | 5.082 | -0.142 | 2.618 |
| New Jersey | 4.990 | -0.252 | 2.486 |
| New York | 5.114 | -0.223 | 2.507 |
| Pennsylvania | 5.175 | -0.159 | 2.564 |
| Lower Atlantic (PADD 1C) |
5.013 | -0.132 | 2.566 |
| North Carolina | 4.985 | -0.141 | 2.543 |
| Virginia | 5.027 | -0.128 | 2.578 |
| Midwest (PADD 2) |
5.208 | -0.166 | 2.593 |
| Illinois | 5.179 | -0.170 | 2.639 |
| Indiana | 5.496 | -0.017 | 2.854 |
| Iowa | 5.031 | -0.230 | 2.456 |
| Kansas | 5.023 | -0.234 | 2.488 |
| Kentucky | 5.433 | -0.038 | 2.845 |
| Michigan | 5.584 | 0.069 | 3.016 |
| Minnesota | 5.076 | -0.233 | 2.441 |
| Missouri | 5.105 | -0.169 | 2.634 |
| Nebraska | 5.072 | -0.226 | 2.495 |
| North Dakota | 4.997 | -0.203 | 2.394 |
| Ohio | 5.917 | 0.066 | 3.322 |
| South Dakota | 5.082 | -0.233 | 2.445 |
| Wisconsin | 5.260 | -0.174 | 2.646 |
| Note: Price in dollars per gallon, excluding taxes. Values shown on the graph and corresponding data pages for the previous week may be revised to account for late submissions and corrections. | |||
| change from | |||
|---|---|---|---|
| 10/30/26 | week ago | year ago | |
| Stocks | 99.3 | -3.6 | -12.3 |
| Production | 5.154 | -0.006 | 0.445 |
| Demand | 4.439 | 0.232 | 0.729 |
| Note: Stocks in millions of barrels. Production and Demand in millions of barrels per day.
*Demand = Product Supplied; approximately represents consumption of petroleum products because it measures the disappearance of these products from primary sources. |
|||
Release Schedule: From October through March, the data are published weekly and are updated every Wednesday after 1:00 p.m. (Eastern time). For weeks that include holidays occurring from Monday through Wednesday, publication is delayed by one day.