Further Sensitivity Analysis of Hypothetical Policies to Limit Energy-Related Carbon Dioxide Emissions
Supplement to the Annual Energy Outlook 2013 — Release date: July 18, 2013
Executive Summary
The Annual Energy Outlook 2013 (AEO2013) included several alternative cases in which hypothetical carbon dioxide (CO2) emission fees were imposed on fossil fuel consumers on an economy-wide basis. The fees start at $10, $15, and $25 per metric ton of CO2 in 2014 and rise at 5 percent per year thereafter. The AEO2013 cases illustrate the impact of policies that might place an implicit or explicit value on CO2 emissions from fuel combustion.
Feedback from EIA customers suggested an interest in additional sensitivity runs that explore variations of such policies, including cases in which a value is placed only on CO2 emissions from electric power facilities rather than on an economy-wide basis, and cases with alternative treatment of the potential revenues associated with the fees. This analysis examines the impacts of fees placed only on the emissions from electric power facilities starting at $10, $20 and $30 per metric ton of CO2 in 2014 and rising 5 percent or 7.5 percent per year thereafter. It also examines the impacts of returning the potential revenues associated with the fees to consumers versus using it for deficit reduction or returning it to businesses. And finally, two cap-and-trade policies with a 50 percent electricity sector emission reduction target are compared to the fee cases. The important questions examined include:
- How sensitive are the electricity generation mix and electricity prices to variations in the level and growth of values placed on CO2 emissions from that sector?
- How does the response to an economy-wide CO2 fee compare to one imposed on the electricity sector alone?
- How do cases with CO2 fees on the electric sector compare to ones in which a cap on emissions is imposed through a tradable allowance program?
- How would the cost and CO2 fees of such a policy be influenced by the flexibility of an alternative to submit emissions offsets for up to 20 percent of the emission allowance?
Key findings:
- The electricity sector is very responsive to the imposition of CO2 fees. Across the four fee trajectories examined, electricity sector CO2 emissions are between 28 and 60 percent below the 2005 level in 2025 and 35 and 89 percent below the 2005 level in 2040.
- The emissions reductions are achieved through large reductions in coal use offset by increases in natural gas (particularly early on), nuclear and renewable fuel use, as well as by reductions in overall electricity use.
- With a CO2 fee starting at $10 per metric ton in 2014 and rising 5 percent per year, coal generation is 24 percent below the Reference case level in 2025 and 37 percent below it in 2040, when it accounts for 23 percent of overall electricity generation. In all of the other CO2 fee cases, coal generation falls to 10 percent to 29 percent of total generation by 2025 and, except for one case, less than 10 percent of total generation by 2040.
- Natural gas-fired generation surges in the early years after a fee is imposed, but tends to return towards or below Reference case levels between 2030 and 2040. In 2025, natural gas-fired generation ranges from 10 percent to 39 percent above the Reference case level in the four CO2 fee cases. However, by 2040 this range falls to between 14 percent below the Reference case level and 5 percent above the Reference case level.
- Renewable and nuclear generation becomes particularly important over time as large numbers of new plants are brought on line as coal plants retire. In 2025, renewable generation in the CO2 fee cases is between 21 percent and 46 percent above the Reference case level. By 2040 the increase ranges from 41 percent to 71 percent above the Reference case level. Relative to the Reference case, nuclear generation is between 0 percent and 12 percent higher in 2025 and 20 to 105 percent higher in 2040 the CO2 fee cases.
- The change in the generation mix and emission fees in the CO2 fee cases leads to higher electricity prices. In 2025 electricity prices are 12 percent to 34 percent higher than in the Reference case, while in 2040 they are 14 percent to 28 percent higher. There are significant differences in Reference case electricity prices and electricity price impacts across regions.
- The imposition of an economy-wide CO2 fee rather than an electricity sector CO2 fee results in only slightly larger emissions reductions, but provides significantly greater fee revenues and has a larger economic impact. In two $20 fee cases that differ only in their coverage, the reduction in total energy-related CO2 emissions differs by a little over a 1-percentage-point by 2040.
- The results in cap and trade cases targeting a 50 percent electricity sector emissions reduction by 2040 are most similar to fee cases with a starting level of $10 in 2014. However, allowance prices in the cap and trade cases are zero until after 2020 even though utilities make plant retirement decisions that reduce emissions prior to that date in anticipation of higher future allowance prices.
- The imposition of CO2 fees or allowance costs slows economic growth, but estimated economic impacts are sensitive to decisions on how to apply the revenue that is provided.
- When the CO2 fees are first imposed there is a shock to the economy that reduces the level of gross domestic product (GDP) relative to the Reference case by between 0.3 percent to 1.2 percent in 2020, which is generally the peak impact year. In real 2005 chain weighted dollar terms, projected GDP, which is $16,863 billion in the Reference case, ranges from $16,664 billion to $16,807 billion in 2020 in the CO2 fee cases. By 2040, the reduction in the level of GDP relative to the Reference case ranges from 0.2 to 0.4 percent in the electricity sector CO2 fee cases. Projected 2040 GDP, which is $27,282 billion in the Reference case, ranges from $27,171 billion to $27,236 billion in the electricity sector CO2 fee cases.
- The same impacts can also be considered in terms of changes in the annual average projected rate of economic growth over the 2014 to 2040 period. In the CO2 fee cases, the annual average rate of economic growth, which is 2.54 percent in the reference case, is reduced by between 0.0023 to 0.0124 percentage points.
- Returning the fee related revenue through business tax adjustments tends to reduce the impact of the policy compared with the two other alternatives considered: consumer rebates or deficit reduction. When the fee-related revenue is returned through business tax rebates, total GDP nearly returns to the Reference case level by 2040.
Introduction
The Annual Energy Outlook 2013 (AEO2013) included several alternative cases in which hypothetical carbon dioxide (CO2) emission fees were imposed on fossil fuel consumers on an economy-wide basis. The fees start at $10, $15, and $25 per metric ton of CO2 in 2014 and rise at 5 percent per year thereafter. The AEO2013 cases illustrate the impact of policies that might place an implicit or explicit value on CO2 emissions from fuel combustion.
Feedback from EIA customers suggested an interest in additional sensitivity runs that explore variations of such policies, including cases in which a value is placed only on CO2 emissions from electric power facilities rather than on an economy-wide basis. This report presents results of a set of additional CO2 policy cases and compares them to a reference case that reflects the American Taxpayer Relief Act of 2012 (ATRA) enacted at the start of 2013. That law, among other things, extended several provisions for tax credits to the energy sector.
The cases included in this report are presented in Table 1. The cases are designed to answer several questions:
- How sensitive is the electricity sector to variations in the level and growth of values placed on CO2 emissions from that sector? Three cases are included with per-metric ton fees starting at $10, $20, and $30 (2011 dollars) in 2014 growing at 5 percent per year in real (inflation-adjusted) terms, and another case with per-metric ton fees starting at $10 in 2014 and growing at 7.5 percent per year.
- How does the response to an economy-wide CO2 fee compare to one imposed on the electricity sector alone? How do emissions reductions compare in the two cases and what is the relative impact on the economy? A case with a $20 per metric ton fee growing at 5 percent a year imposed economy-wide is compared to a case with the same fees imposed on the electricity sector only.
- How do cases with CO2 fees on the electric sector compare to ones in which a cap on emissions is imposed through a tradable allowance program? A market-based cap on emissions effectively imposes an incremental, opportunity cost on emitting CO2 through a requirement to submit allowances for emissions. These marginal cost incentives are largely equivalent to those imposed through a CO2 fee on emissions, such that either approach could be used to provide the same emissions reductions with roughly the same effects over time. In particular, what CO2 fees, or equivalent allowances prices, would be required each year to gradually cut annual CO2 emissions in the electricity sector by half the 2012 level by 2040? The 50-percent electricity cap-and-trade case illustrates this scenario.
- How would the cost and CO2 fees of such a policy be influenced by the flexibility of an alternative to submit emissions offsets for up to 20 percent of the emission allowance requirement? An electricity cap-and-trade case with offsets illustrates that variation to the cap-and-trade scenario.
- How does the use of revenues from carbon fees affect economic impacts? How would the economic impacts change if carbon fees were used to reduce the deficit rather than returning the fee revenue to consumers through tax rebates? How would the impacts change if carbon fee revenue was rebated to reduce corporate taxes on a revenue neutral basis?
The cases presented in this report were prepared using the National Energy Modeling System, generally as configured for AEO2013; however, as indicated above, an updated Reference case was prepared with assumptions modified to reflect ATRA. The sensitivity cases listed in Table 1 differ from the updated Reference case only by the settings indicated.
Findings
A CO2 fee provides an economic incentive to reduce emissions through its effects on energy-related investment decisions, choice of fuels, and other market responses. Generally, the higher the fee and faster its rate of growth over time, the greater the emission reduction response. CO2 fees impose an incremental cost of using fuels that is proportional to the carbon content of the fuel, so that a given fee has greater incremental impact on coal than natural gas.
When the fees are applied across the economy, the effect on delivered (fee-inclusive) energy prices is directly reflected in all uses of fossil fuels. When applied only in the electricity sector, the higher delivered cost of fossil fuels to power producers results in higher electricity prices. Responses in the power sector also change the overall demand for each of the fossil fuels, which can affect the prices paid by consumers who use these fuels directly.
A summary of results for selected cases that demonstrate the range of CO2 reductions and economic impacts examined is provided in Tables 2 and 3. Full results for the case are available through the Interactive Table Viewer.
CO2 fees
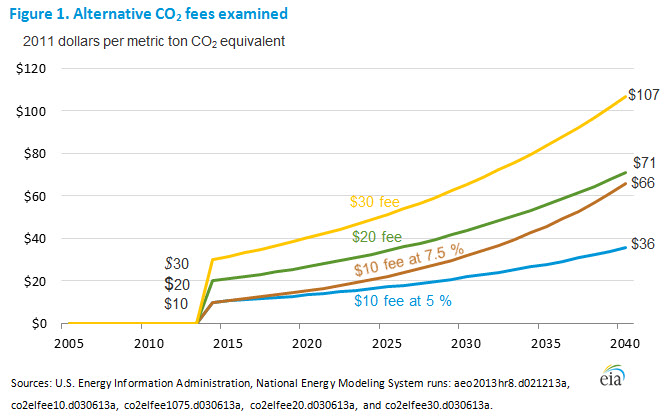 The CO2 fees considered in the fee cases developed in this report start at $10, $20 and $30 per metric ton of CO2 in 2014 and grow at either 5 or 7.5 percent per year over time (Figure 1). By 2040 they range between $36 and $107 per metric ton of CO2. The allowance prices in the cap-and-trade cases are generally much lower, particularly in the near term, than the fees in the four fee cases (Figure 2). In both of the cap-and-trade cases the emissions target is set to 50 percent below the 2012 level by 2040. The target is assumed to decline linearly from the emission level in 2012 to the final target in 2040. Both cap-and-trade cases assume no banking of allowances, but one allows offsets to be used for up to 20 percent of their covered emissions as a compliance option, while the other does not. The assumed offsets reflect a potential program to allow non-covered entities to register either reductions in non-CO2 greenhouse gases or increases in carbon sequestration through changes in forestry and agriculture practices. While the supply of offsets is uncertain, they have the potential to lower compliance costs significantly. In the cap-and-trade case with offsets, the estimated allowance price in 2033 is less than half the price in the cap-and-trade without offsets case.
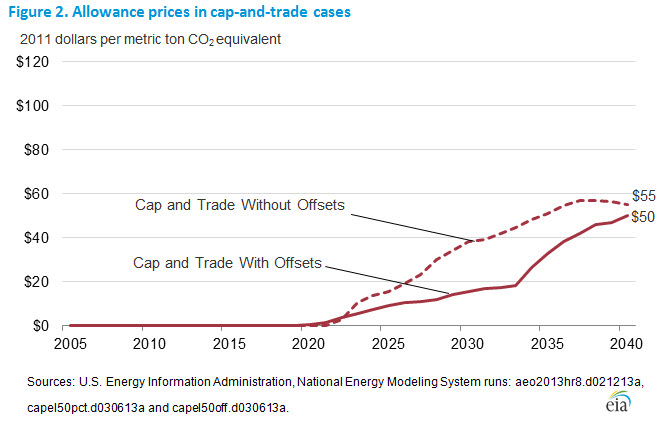 In all cases, covered entities are assumed to be aware of future allowance prices and CO2 fees, so investment decisions take current-year and future-year CO2 fee or allowance values into account. This foresight assumption leads to an interesting outcome, particularly in the cap-and-trade cases. In those cases, simulated allowances prices in the first few years were driven to zero based on forward-looking investment behavior by coal plant owners. In anticipation of future allowance prices that would eventually make many of their coal plants uneconomical, they retire some of their coal plants earlier to avoid the interim costs of upgrading them to meet environmental regulations that take effect in 2016.1 These coal plant retirements cause emissions over the 2014 to 2020 period to fall below the assumed caps even though allowance prices do not rise above $1 per metric ton CO2 until after 2020.
CO2 emissions
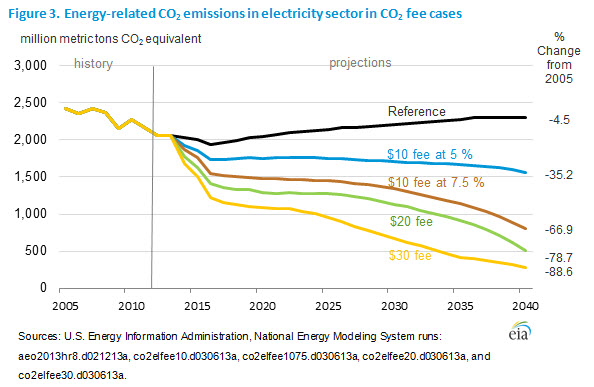 The electricity sector exhibits a strong response to CO2 fees by altering investment and operating decisions to reduce emissions, while electricity consumers react to higher prices by cutting their demand for electricity. Emissions decline rapidly in the first three years after introduction of the carbon fees, 2014-2016, as power companies initially react to the emissions fees by retiring coal plants rather than investing in them to bring them into compliance with upcoming environmental regulations (Figure 3). This leads to an increase in natural gas use. Emissions reductions continue after 2016, but at a slower pace. The magnitude of the CO2 emissions response is strongly related to the CO2 fee levels assumed, particularly in the early years, but reductions from the Reference case occur throughout the projection. By 2040, energy-related CO2 emissions in the electricity sector are less than half the 2005 level in three of the four CO2 fee cases. The $30 fee case induces an emission reduction in the electricity sector of 89 percent from 2005 levels by 2040.
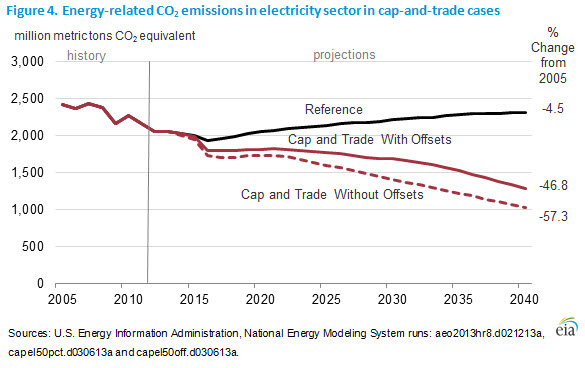 In the two cap-and-trade cases, the emission target in 2040 was assumed to be half the 2012 level, or about 57 percent below the 2005 level (Figure 4). Some over-compliance or excess emissions reductions occur in the first five years. Again, the anticipation of future allowance prices drives some retirement and investment decisions, leading to greater emissions reductions than required in the early years of the projections. The difference in CO2 emissions shown between the two cap-and-trade cases reflects the quantity of offsets used in the case with offsets. The effect on CO2-equivalent greenhouse gas emissions in the two cases would be essentially the same, but reductions in the offsets case include non-CO2 emissions reductions in non-covered sectors, as well as increases in carbon sequestration in agriculture and forestry. No energy-related CO2 offsets were simulated from the non-covered sectors, as might be allowed under an electricity-only cap-and-trade offset policy. Comparing the emissions reductions in the cap-and-trade cases to those in the fee cases shows that the two $10 fee cases produce emissions reductions most similar to the 50 percent reduction target called for in the cap-and-trade cases.
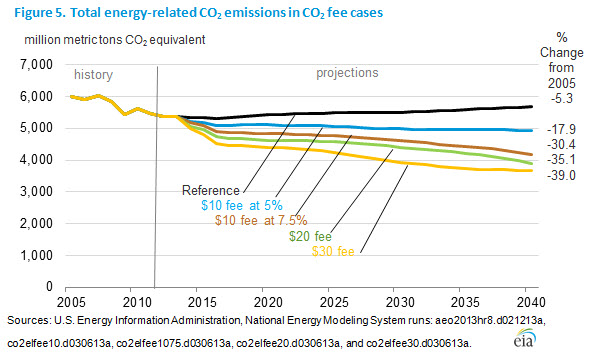 The change in total U.S. energy-related CO2 emissions in 2040 relative to 2005 emissions ranges from 18 percent to 39 percent across the fee cases (Figure 5), lower than the 35 percent to 89 percent reductions seen in the power sector alone. This difference reflects the fact that in 2011, the electricity sector accounted for about 40 percent of total U.S. energy-related CO2 emissions.
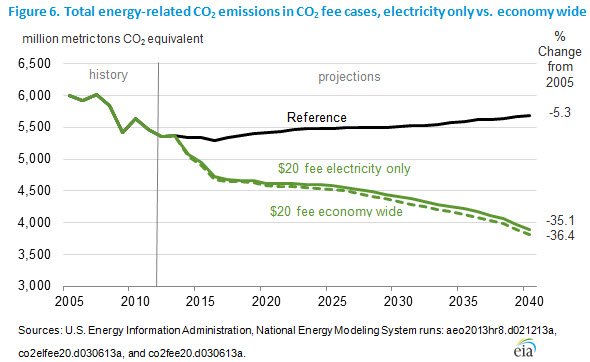
One interesting finding in this analysis is shown in Figure 6, comparing energy-related CO2 emissions in two $20 fee cases that differ only in their coverage. In one case, only the electricity sector is covered, while in the other, all energy-related CO2 emissions throughout the economy are covered. The total CO2 emissions in the economy-wide coverage case are only slightly lower than in the electricity sector coverage case, and in both cases, the emissions reductions are almost entirely attributable to electricity sector actions. By 2040, there is only a little over a 1-percentage-point difference in the total emissions reduction from the 2005 level.
 Many factors including changing fuel prices and slowing energy demand growth contribute to the relatively small emissions reductions seen in the fee cases outside of the electricity sector. Recent changes in energy regulations may be a particularly important factor. For example, the Reference case incorporates the recently-extended fuel economy and tailpipe emission standards for light-duty vehicles. The rulings mandate increasingly stringent improvements in CO2 emissions and fuel economy between 2017 and 2025. As a result, the Reference case projects a 16-percent reduction in CO2 emissions from all light-duty vehicles between 2011 and 2025. Since these standards lead to technology adoption for fuel economy in excess of what might otherwise occur, increases in gasoline prices from a CO2 fee have limited incremental effect on consumer or manufacturer decisions to adopt fuel-saving technology. In addition, any increases in driving costs from CO2 fees on gasoline would be tempered by the high fuel economy of the vehicle fleet already in place to meet the fuel economy standards.
Generation by fuel
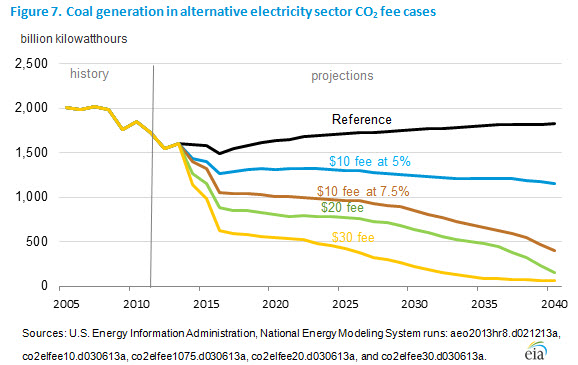 The imposition of CO2 fees or allowance prices on the power sector has significant impacts on the mix of fuels used to generate electricity. The fees raise the cost of using fossil fuels, making it more economical to use less carbon intensive fuels or technologies that capture and store the CO2. Among the fuels used to generate electricity, coal is most impacted by the imposition of a CO2 fee (Figure 7), particularly when the fee starts above $10 per metric ton of CO2 or rises more rapidly than 5 percent per year. When the CO2 fee starts at $10 per metric ton and rises 5 percent per year, coal generation falls below the Reference case levels, but it continues to account for a significant share of overall electricity generation. In this case, coal generation is 24 percent below the Reference case level in 2025 and 37 percent below it in 2040, when it accounts for 23 percent of overall electricity generation. In all of the other CO2 fee cases, coal generation falls to 10 percent to 29 percent of total generation by 2025 and, except for one case, less than 10 percent of total generation by 2040. In the case where the CO2 fee starts at $10 per metric ton and rises 5 percent per year, just over one-third (36 percent) of existing coal capacity is retired by 2040 while in the other fee cases more than 75 percent of current coal capacity is retired by then.
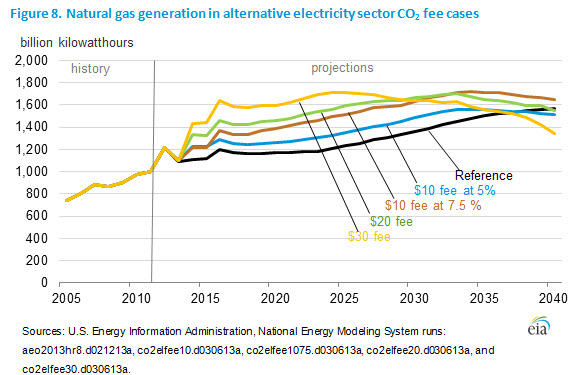 The implications for natural-fired generation differ significantly from those for coal (Figure 8). When the CO2 fee is first imposed, power plant owners retire a large amount of existing coal capacity rather than make investments to bring it into compliance with upcoming environmental regulations. Since companies know that the CO2 fees will rise over time, they take this into account in their environmental retrofit investment decisions and, in many cases, choose not to go forward with them. This leads to a sharp increase in natural gas-fired generation to replace the power formerly supplied by existing coal plants. Over time, however, as the CO2 fees continue to increase, non-emitting sources like new renewable and nuclear plants become increasingly attractive. As these new zero-CO2 emitting plants are brought on line, the generation contribution from natural gas-fired plants falls towards or below Reference case levels, particularly in the higher fee cases. In 2025, natural gas-fired generation ranges from 10 percent to 39 percent above the Reference case level in the CO2 fee cases. However, by 2040 this range falls to between 14 percent below the Reference case level and 5 percent above the Reference case level in the CO2 fee cases. A portion of the natural gas generation in the later years in the CO2 fee cases, particularly in the $30 fee case, comes from new natural gas plants with carbon capture and storage equipment.
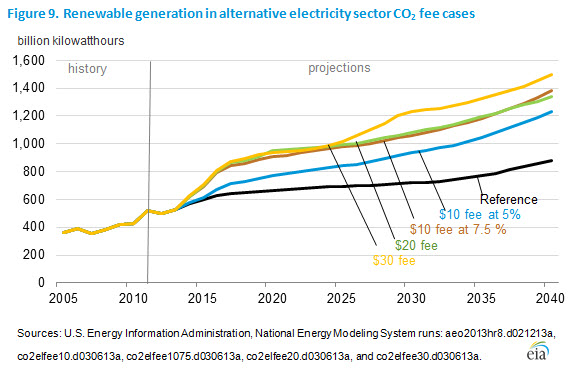 Similar to natural gas, renewable generation shows strong growth in the early years when the CO2 fees are first imposed (Figure 9). However, unlike natural gas, the increase above Reference case levels continues to grow over time as new renewable capacity is added. In 2025, renewable generation in the CO2 fee cases is between 21 percent and 46 percent above the Reference case level. By 2040 the increase ranges from 40 percent to 71 percent above the Reference case level. The share of total generation accounted for by renewables ranges from 25 percent to 31 percent in 2040 in the CO2 fee cases, much higher than the 17 percent share achieved in the Reference case. Among the specific renewable sources, wind, solar, biomass and geothermal all contribute to the increase in renewable generation in the CO2 fee cases, but their relative contribution varies from case to case, particularly for biomass. Biomass can be burned in dedicated plants and co-fired along with other fuels like coal. In the $10 CO2 fee cases, it becomes attractive to reduce coal use through increased co-firing of biomass and this leads to a large overall increase in biomass generation. In the higher CO2 fee cases, however, most coal capacity is eventually retired, reducing the opportunity for co-firing. Large increases in wind and solar capacity occur in the CO2 fee cases. In the Reference case, wind capacity increases from 46 gigawatts in 2011 to 101 gigawatts in 2040. In the CO2 fee cases, wind capacity ranges from 154 to 220 gigawatts in 2040. The pattern is similar for solar. In the Reference case, solar capacity increases from 5 gigawatts in 2011 to 44 gigawatts in 2040, but in the CO2 fee cases, capacity ranges from 60 to 152 gigawatts in 2040.
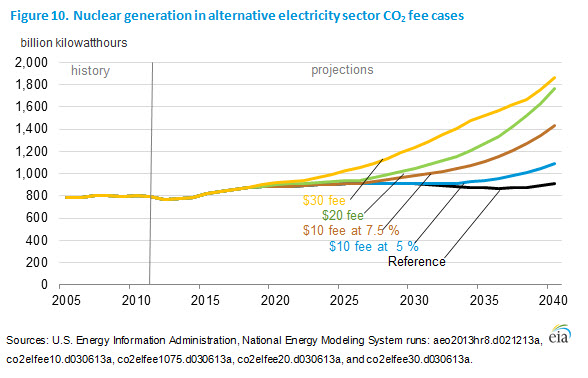 Nuclear generation, like renewable generation, increases in all of the CO2 fee cases, but its growth occurs later, mostly after 2025 and 2030 (Figure 10). The development timeline for new nuclear capacity is generally longer than for other capacity types. Relative to the Reference case, nuclear generation ranges from unchanged to 12 percent higher in 2025 in the CO2 fee cases. By 2040, the increase in nuclear generation relative to the Reference case grows to from 20 percent to 105 percent higher in the CO2 fee cases. While not entirely unprecedented, the rate of nuclear expansion seen in the $20 and $30 fee cases rivals or exceeds the rate of expansion seen between 1970 and 1990 in the United States, and it may be challenging to repeat that rate of growth again. For example, in the $30 fee case, 135 gigawatts of new nuclear capacity are added between 2015 and 2040, substantially exceeding the 90-plus gigawatts of nuclear capacity that was added between 1970 and 1995.
Electricity prices
The imposition of CO2 fees leads to higher fossil fuel and electricity prices, and slower economic growth, but the impacts vary significantly with the level of the fees imposed, the uses of the fee revenue and the coverage of the program. Across the CO2 fee cases, electricity prices are 12 percent to 34 percent higher than in the Reference case in 2025 and 14 percent to 28 percent higher in 2040 (Figure 11). The percentage changes and the electricity prices shown in Figure 11 are average delivered prices to all consumers, including homes, commercial buildings, and industrial facilities.
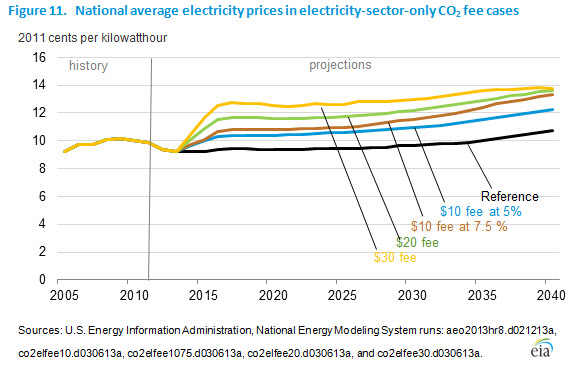 The CO2 fees raise the cost of using fossil fuels to generate electricity. For example, in 2025, the cost of coal to power plants without carbon capture and storage equipment is $2.69 per million Btu in the Reference case, but it is $3.70 in the $10 fee case, $4.85 in the $20 fee case and $6.01 in the $30 fee case. The cost of using coal increases even further by 2040, ranging from $6.33 to $12.30 per million Btu in the CO2 fee cases versus $3.20 in the Reference case. The impacts on natural gas prices are smaller than those for coal because of its lower carbon content, but they are still significant. The cost of using natural gas for power generation in 2040 ranges from $9.94 to $13.31 per million Btu in the CO2 fee cases versus $8.33 in the Reference case.
While CO2 fees raise electricity prices through their impact on generation costs, they do not affect electricity distribution costs, which typically constitute a larger share of the electricity price for residential consumers than for industrial consumers, who typically pay lower overall prices. Therefore, in each of the CO2 fee cases, the percentage increase in residential electricity prices tends to be significantly smaller than the percentage increase in industrial electricity prices.
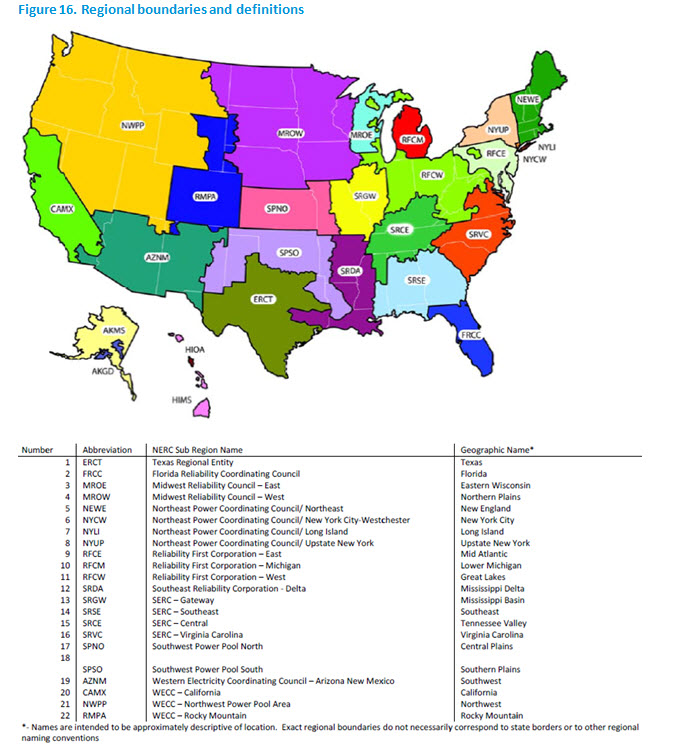
Current electricity prices, as well as projected electricity prices in the Reference case and the change in electricity prices in the CO2 fee and cap-and-trade cases considered in the paper, vary significantly across U.S. regions. Table 4 shows actual 2011 regional prices and projected reference and alternative case prices in 2025. Table 5 displays the same for 2011 and 2040 in the CO2 fee cases, while Figure 16 displays the regions.
Economic Impacts
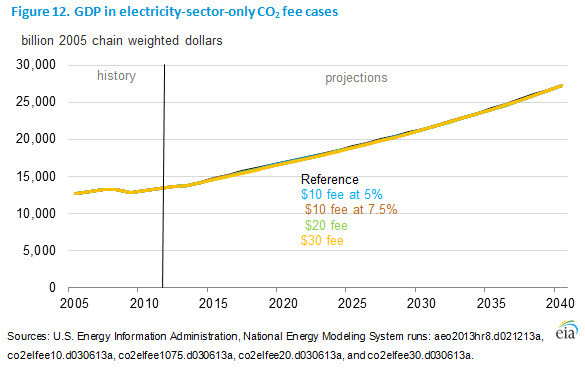 The higher consumer electricity prices (and higher consumer fossil fuel prices when the coverage extends beyond the electricity sector) in the CO2 fee cases tend to slow economic growth. Figures 12 and 13 display the economic impacts in alternative ways. Figure 12 shows total U.S gross domestic product (GDP) in the Reference case and the four CO2 fee cases. As shown, the impacts are hard to discern, the thickness of the lines in the figure obscure them.
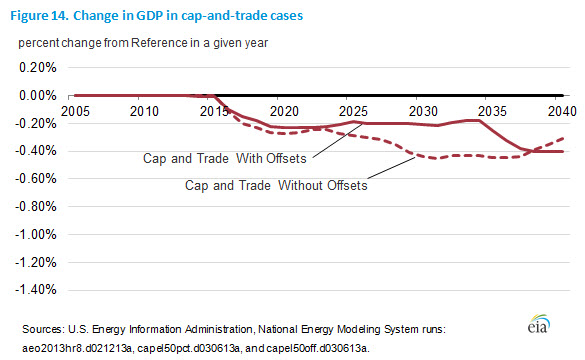
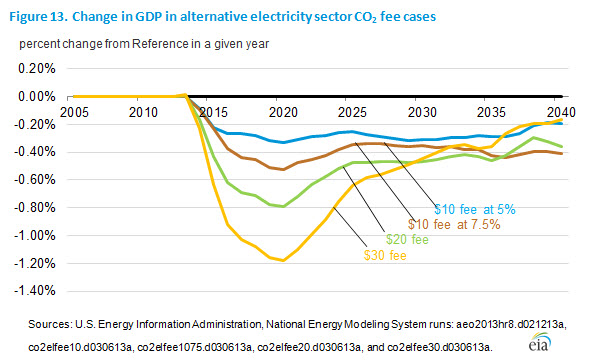 Figure 13 displays the same information in a different way, showing the percentage change in GDP in the CO2 fee cases relative to GDP in the Reference case. Initially as the CO2 fees are first imposed there is a shock to the economy leading to a reduction in GDP of 0.3 percent to 1.2 percent in 2020, which is generally the peak impact year. In real 2005 chain-weighted dollar terms, projected GDP, which is $16,863 billion in the Reference case, ranges from $16,664 billion to $16,807 billion in 2020 in the CO2 fee cases. Over time, the impacts fall as the economy adjusts, the power sector converts to lower emitting sources and consumers spend the revenue associated with the fees that is rebated to them. By 2040, the reduction in GDP relative to the Reference case in the CO2 fee cases ranges from 0.2 to 0.4 percent. Projected 2040 GDP, which is $27,282 billion in the Reference case, ranges from $27,171 billion to $27,236 billion in the electricity sector CO2 fee cases. Figure 14 shows the same information for the cap-and-trade cases and illustrates that their economic impacts are similar to those in the two $10 fee cases.
 The impacts in the alternative cases can also be considered in terms of changes in the annual average projected rate of economic growth over the 2011 to 2040 period. In the CO2 fee cases, the annual average rate of economic growth, which is 2.51 percent in the reference case, is reduced by between 0.006 to 0.014 percentage points.
 In all of the fee cases, industrial and employment impacts tend to follow GDP changes, with energy-intensive industries experiencing higher percentage changes from Reference case levels compared to all of manufacturing and overall industry as well.
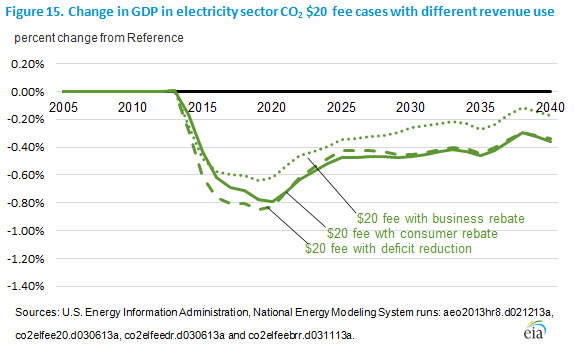
 While the fee level is important in estimating the potential economic impact of the program, other important factors include how the revenue associated with the CO2 fees is used and the coverage of the program. In most of the cases discussed in this report it is assumed that all the fee revenue is rebated to consumers. Other options include using the fee revenue to reduce the deficit or returning it to businesses through lower business taxes.
In general, using the fee revenue for deficit reduction rather than rebating it to consumers, leads to a larger adverse impact on the GDP in the near term. This occurs because personal consumption, a major portion of GDP, is much lower when the fee revenue is not returned. Conversely, when the fee revenue is returned to businesses, the economy tends to be better off because businesses increase their investments that lead to greater productivity and economic growth. As shown, when the revenue is returned through business tax rebates, total GDP nearly returns to the Reference case level by 2040. However, personal consumption remains lower when the revenue is returned to businesses rather than consumers.
Footnote
1 Section 112 of the Clean Air Act Toxic Standards (MATS). Compliance with MATS is expected to require all coal plants to add emission control equipment, such as flue gas desulfurization and dry sorbent injection by 2016, or to be retired.