Probabilities of Possible Future Prices
April 1, 2010
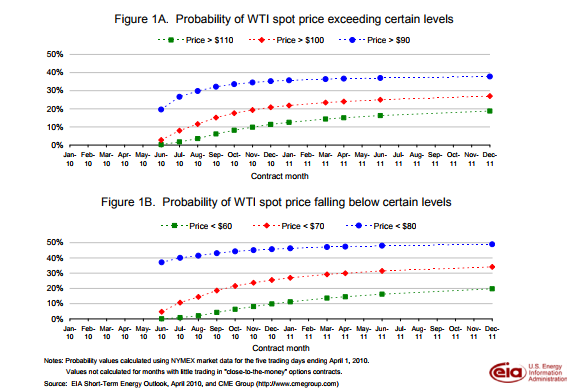
EIA introduced a monthly analysis of energy price volatility and forecast uncertainty in the October 2009 Short-Term Energy Outlook (STEO). Included in the analysis were charts portraying confidence intervals around the New York Mercantile Exchange (NYMEX) futures prices of West Texas Intermediate (equivalent to light sweet crude oil) and Henry Hub natural gas contracts. The March 2010 STEO added another set of charts listing the probability of the future realized price exceeding or falling below given price levels (see Figures 1A and 1B for West Texas Intermediate crude oil price probabilities). These charts are also available as spreadsheets allowing users to input their own prices to see the probability of the final realized price exceeding or falling below those inputs. The following is an explanation to help users understand their results.
The probabilities in these charts are derived by taking the market-cleared estimate of implied volatility using the Black-Scholes-Merton model (see Energy Price Volatility and Forecast Uncertainty documentation for a more detailed discussion.). This model assumes a commodity’s price follows a random walk having an expected return of zero. The likelihood of a 1-percent increase in value is equal to the likelihood of a 1-percent decrease in value. The market is assumed to be a “fair game,” meaning neither the buyer nor the seller has a positive or negative expected return when they engage in a purchase or sale, i.e., the buyer and seller have the same likelihood of success. Under this assumption, no one knows for certain if the price will rise or fall before the contract closes, and the expected value of the realized price is exactly the futures contract price at every point in time.
An equal likelihood of a 1-percent gain or loss does not mean, however, that there is an equal chance of the price rising or falling. The calculated probability of the realized price exceeding the current futures price is less than 50 percent, and the probability of the price falling below is greater than 50 percent. For example, the probability of the eventual December 2010 spot price being above the $84.56 December 2010 futures contract price is 45.1 percent and the probability the spot price will be below is 54.9 percent (Figure 2). This is a result of the log-normal distribution of absolute prices as opposed to the assumed normal distribution of returns.
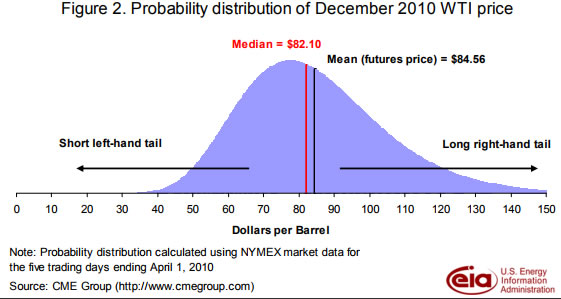
Returns in the Black-Scholes-Merton model are normally distributed around zero, but absolute prices are log-normally distributed. In a log-normal distribution there is a constraint on the left-hand side (low prices) but not the right-hand side (high prices). Prices cannot fall below zero, but they theoretically have no upper bound. The probability distribution is skewed with a long right-handed tail (Figure 2) so that the mean differs from the median. The median price is the price corresponding to the 50th percentile. The realized price has an equal probability of falling above or below the median price. The futures market price, however, represents the mean and lies to the right of the median in a positively-skewed distribution. Therefore, there is a greater than 50-percent chance that the future realized price will be below the futures price.
The asymmetric probabilities around the futures price reflect the implication of a mathematical assumption underlying the Black-Scholes-Merton model. An intuitive explanation for the asymmetric probabilities is that the futures price reflects the needs of traders to hedge. Traders not only care if the price rises or falls but also how much the price rises or falls. Prices can only fall to zero, but there is no theoretical upper limit to how far they can rise. The greater probability of a price below the mean is offset by the possibility of a price much higher than the mean.